Over the past 12 months, growth and inflation have generally improved globally and China has been no exception to this trend. Analysis of primarily ‘traditional’ economic statistics in China could have underestimated this strength, as many traditional indicators are relatively stable and consistent through time. However, by including alternate measures of growth in our analysis we believe that a more nuanced picture of the Chinese economy can emerge.
The Importance of China
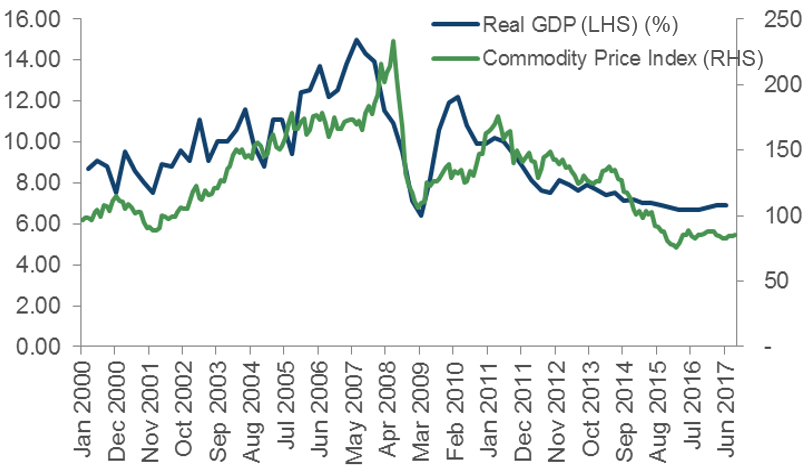
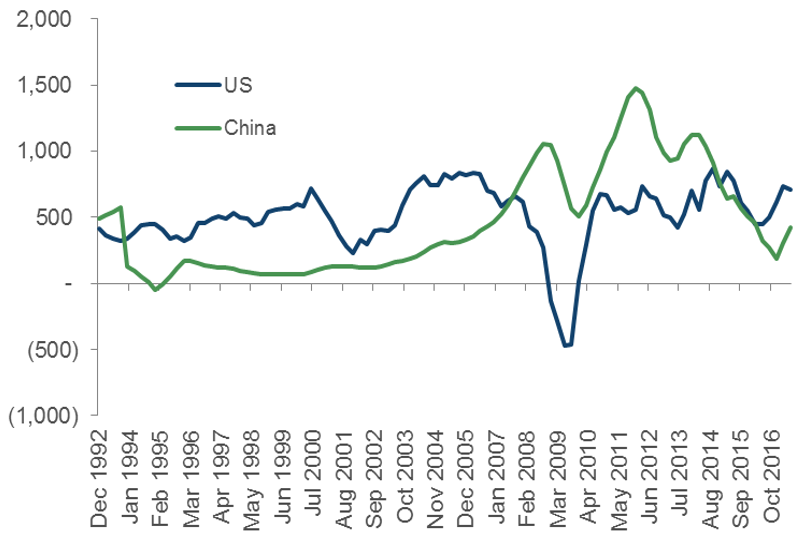
Chinese statistics are often seen by markets to be unreliable as they have a remarkable ability to meet consensus forecasts and generally suffer little volatility. A good example of this is Real GDP which rarely deviates from the stated party goals and has ranged between 6.7% and 7.9% since 2013 despite large changes in commodity prices over the same period. Due to this strong growth the Chinese economy continues to rise in importance and in many years has achieved more growth in outright US dollar (USD) terms than the US. This means investors should not ignore the economic signs based on an assumption that ‘it is made up anyway’, as China is quickly becoming one of the most important economies globally.
Chart 1: Commodity prices vs China GDP
Source: Bloomberg
Chart 2: Change in nominal GDP (YoY) in USD
Source: Bloomberg
What else can we watch?
To help bridge this gap between the perceived unreliability of Chinese statistics and the importance of analysing the world’s second largest economy, we look for measures which have less potential to be manipulated. Many of these indicators show that the improved trajectory of Chinese growth has been in motion for 18 months and could have been a major factor behind the pickup in global growth. These measures include monetary statistics, commodity prices, trade volumes and exchange rates.
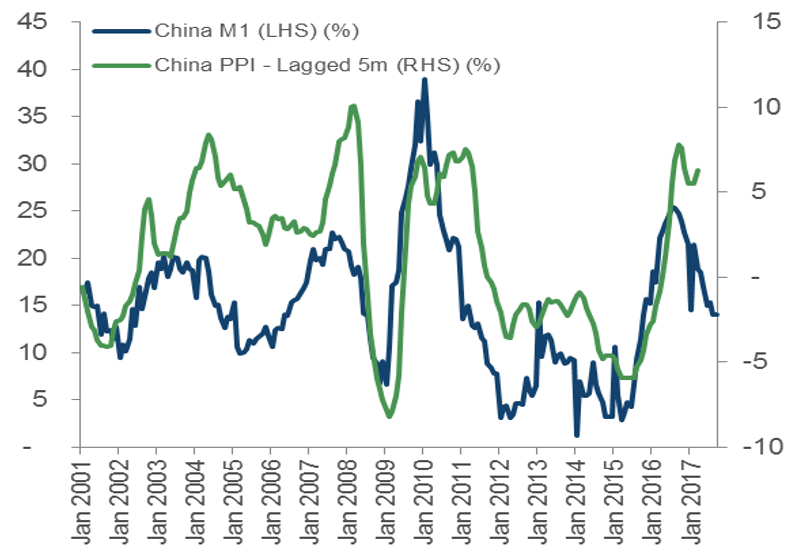
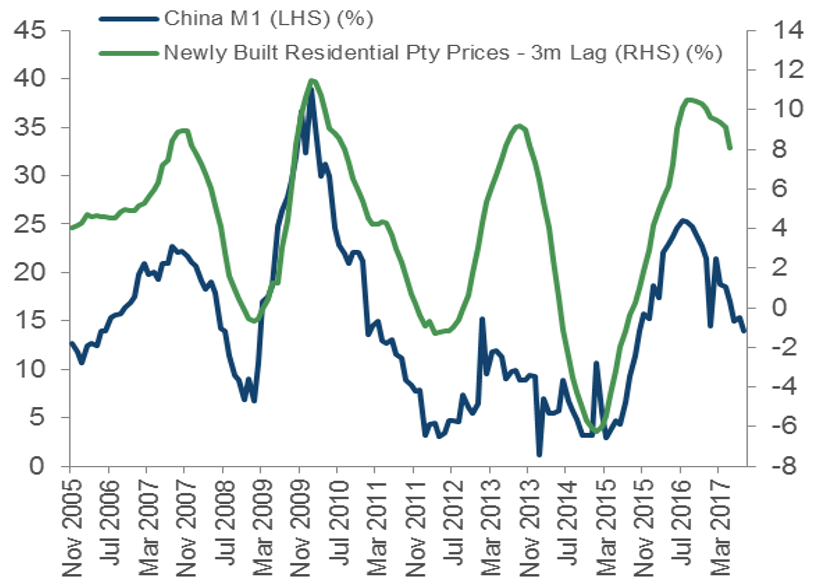
The first sign of an improving economy can be found in the monetary statistics, particularly M1 which began to rapidly expand through the end of 2015 and peaked in late 2016. Over the past 10-15 years the M1 statistic has led producer prices by approximately five months and hence saw Chinese input prices rise from -5% to +7% over the same period (Chart 3). Given China is the world’s largest manufacturer and low cost exporter, the prices with which it can fuel its industrial capacity represent an important metric for both global demand and inflation. In addition, the M1 statistic gives a relatively strong lead to residential property prices, which rose from -6% in 2014 to +10% in 2017. Using these two measures, an early sign of the Chinese economy beginning to stabilise could have been observed as an inflationary pulse was set to turn up at the end of 2016. These improved metrics have allowed Chinese corporates to see increased top line revenue growth and improved net profit margins, a notion which was hard to come by from 2012 to 2015.
Chart 3: China M1 vs Producer Prices
Source: Bloomberg
Chart 4: China M1 vs Property Prices
Source: Bloomberg
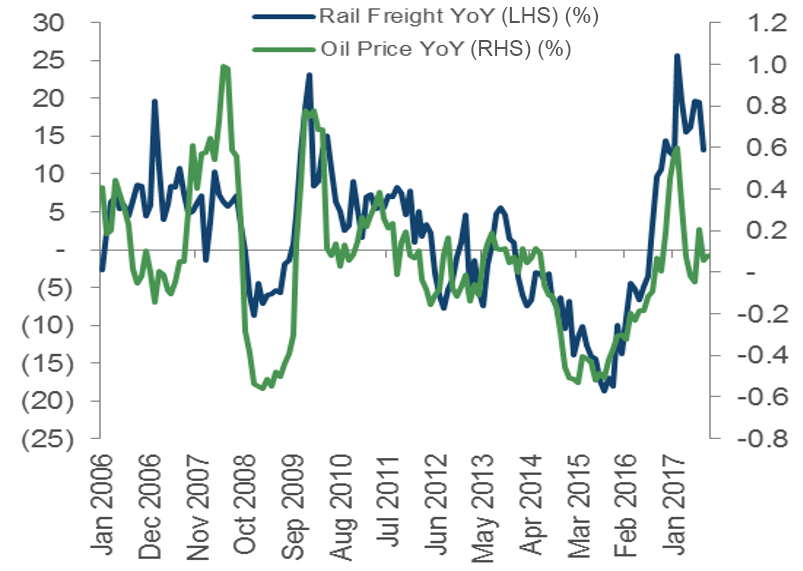
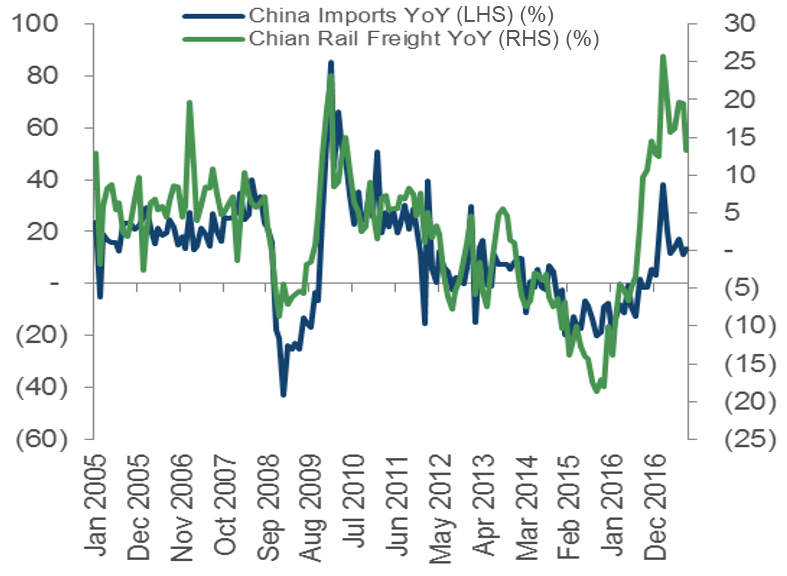
The second metric to watch is commodity prices, which have also been signaling an improving Chinese economy. An example of this can be seen in the comparison of the oil price to rail freight volumes (Chart 5), which is an indicator of industrial activity occurring in China. As oil prices fell through 2014/2015 it was mirrored by a reduction of freight tonnage and coincidently a reduction in import volumes. With oil prices stabilising in 2016/2017 a large rebound in both rail volumes and import volumes occurred, pointing to improved demand from China. Given oil prices continue to hover around USD 50 per barrel, this implies that trade volumes in China should begin to level out over the next six months. While this is lower than the growth observed in the recent past, it would be a vast improvement to the falling volumes of 2014/2015.
Chart 5: Chinese Freight vs Oil Price
Source: Bloomberg
Chart 6: Chinese Imports vs Freight
Source: Bloomberg
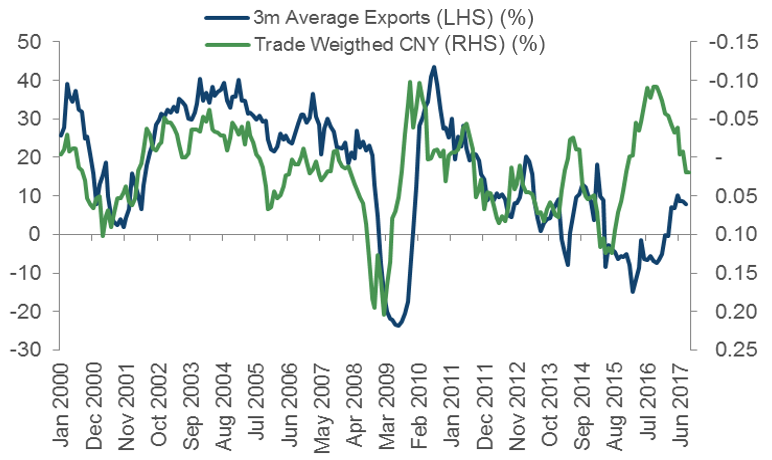
Given the slowdown in global trade and the world economy that occurred throughout 2014/2015 it is likely that the rising USD, with which the Chinese Yuan (CNY) was pegged, was contributing to a slow-down of the Chinese economy. This can be seen below as an appreciating trade-weighted CNY slowed export volumes. Throughout 2016 the trade-weighted CNY was devalued by approximately 10% which subsequently led to an increase in exports. The increase in exports that has occurred so far during 2017 does not match the usual expansion associated with a 10% devaluation, however it is another welcome sign of improvement in the Chinese economy given export volumes were falling throughout 2015.
Chart 7: Chinese Exports vs Trade Weighted CNY
Source: Bloomberg
Flowing through to the rest of the world
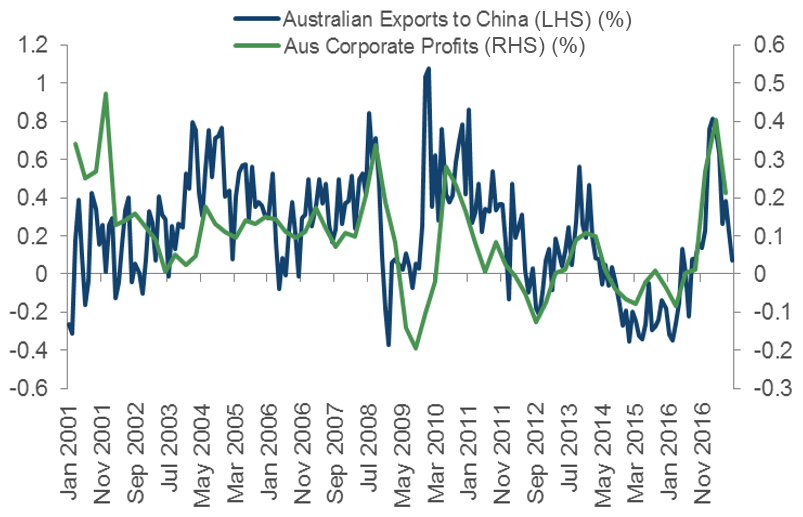
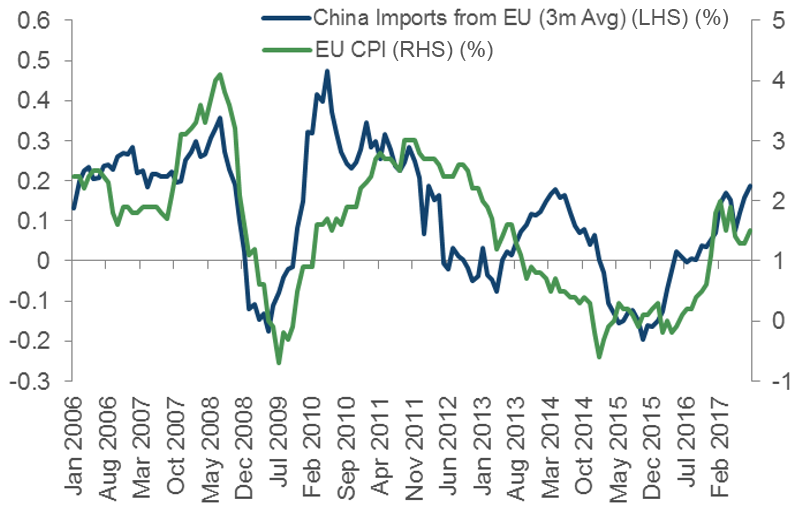
In light of this improvement in the Chinese economy it is also important to appreciate how this travels around the world. The most obvious place to look for this is through trade, as China imports large amounts of materials to manufacture goods and completes vast amounts of infrastructure and construction. This can be seen in commodity exporting countries like Australia, where corporate profit growth has directly mirrored the amount of exports flowing to China. Additionally when focusing on other Australian metrics, a similar relationship can be found in the terms of trade and Gross National Income. Looking at Europe there is also a loose relationship between Chinese imports from the European Union (EU) and EU Inflation. As China increasingly becomes an important location for European exports, trade statistics have been steadily moving in line with EU prices as seen in the chart below.
Chart 8: Australian Profits vs Exports to China
Source: Bloomberg
Chart 9: Chinese Imports from EU
Source: Bloomberg
These relationships show how the Chinese economy can filter out into global economies and aid global growth. For this reason, it is becoming increasingly important to determine how strong the Chinese economy is and what direction it is likely heading. Fortunately, alternate growth measures can be monitored in real time and potentially forecast into the future based on the current environment.
Looking Forward
Over the past 12 months the alternate indicators have been showing that a growth pulse would be imminent in China and this has subsequently been mirrored in Nominal GDP. At present these indicators are pointing to a slowing economy, albeit from relatively robust levels. Looking forward these metrics should also be watched with caution as the reactive decisions of both overseas central banks and the Chinese authorities can quickly affect their direction.
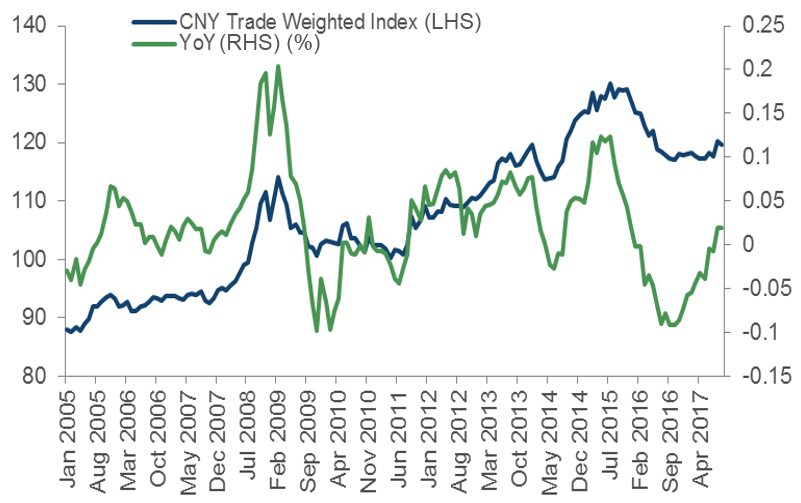
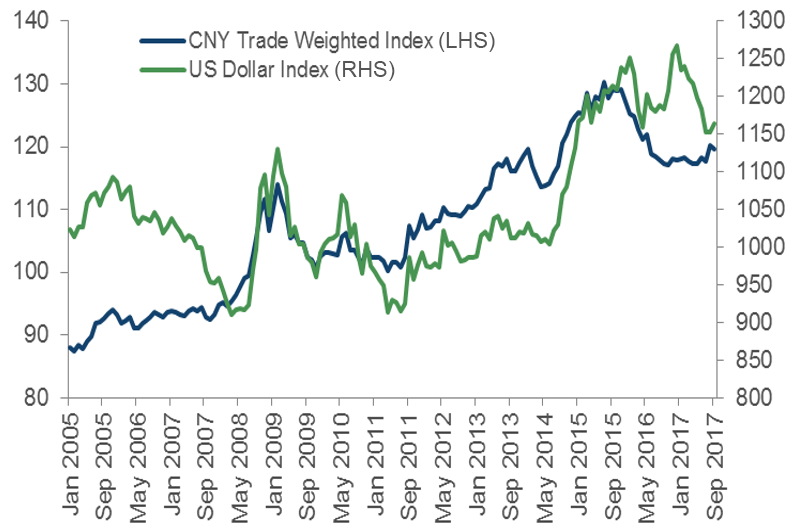
With regards to the trade-weighted CNY, the current trend suggests the currency will stabilise on a year-on-year basis as the prior devaluation washes out. This would represent a relatively benign outlook for export growth over the coming 12 months, potentially comparable to 2012/2013. The complication with this however is that the CNY is loosely pegged to the USD, meaning a rising USD would create further appreciation of the CNY and potentially lower export volumes. Hence going forward, as the US unwinds Quantitative Easing, it will be important to monitor both the USD and the CNY’s reaction to that.
Chart 10: China CNY
Source: Bloomberg
Chart 11: CNY vs USD
Source: Bloomberg
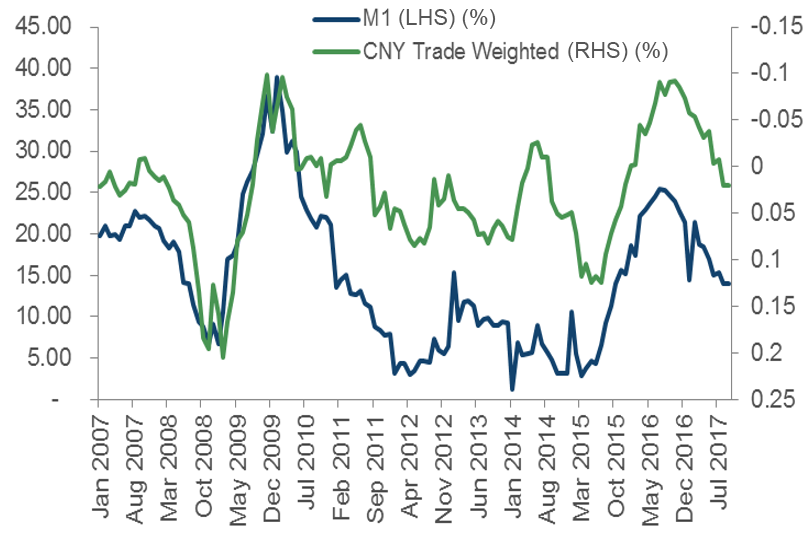
On M1, the trend has begun to slow and at current rates would take approximately 6-9 months to reach levels associated with 2013-2015. This implies that we could begin to see some of the air come out of the property sector and producer prices. Forecasting beyond this period is relatively difficult as Chinese officials need to balance sustainability against increased leverage, as increasing the money base can encourage greater lending. This makes the probable outcome a slow-down from the current levels in M1, which is also being corroborated by the slowing of the depreciation in the trade-weighted CNY.
Chart 12: M1 vs CNY
Source: Bloomberg
Combining the outlook for the currency and M1 statistics suggests that nominal growth should begin to slow over the next 12 months, albeit from a strong pace which has been supportive of the global economy.
Clearly, the alternative growth measures can change rapidly and flow through to the economy in a relatively fast manner. As such it is important to monitor these growth measures and be aware of shifts which could change the investment landscape in China and ultimately the global economy. At the moment we believe these measures are indicating that we have likely just passed the peak of Chinese growth in the short term, but the momentum should remain robust.


