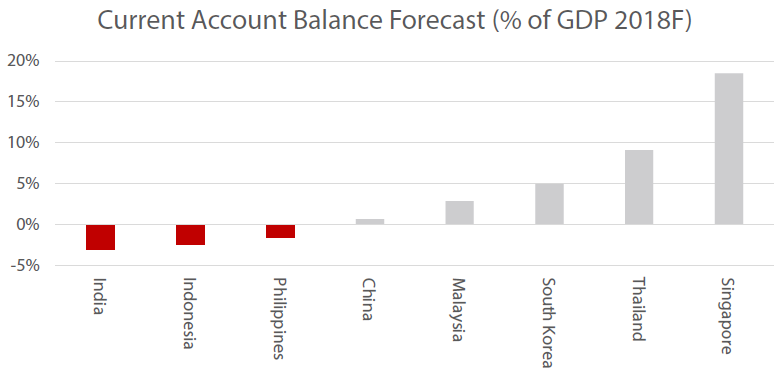
On the back of unrelenting USD strength, 2018 has been a tumultuous period for Asian currencies. Countries in the region with current account deficits have been facing more currency pressure, prompting their central banks to engage in series of rate hikes to defend their currencies. Given that current account balances have always been a focal point during periods of EM weakness, we find it worthwhile to look deeper into some of the individual Asian countries’ current account balances, and whether these balances truly reflect the strength of the underlying economies.
Asia, as a whole, still runs a decent current account surplus with the rest of the world. However, the magnitude of surplus is shrinking, as investment in Asia rises vis-à-vis their savings. Thus, the IMF projects Asia’s current account surplus to shrink to 1.8% in 2019 from 2.7% in 2015.
Running a current account deficit per se is not necessarily bad for an economy. Instead, what drives the deficit and its trend going forward probably is what really matters. Recently, at the IMF conference in Bali, Tharman Shanmugaratnam (Chairman of the G30, Chairman of the Monetary Authority of Singapore) was quoted during an interview saying: “It’s crazy that current account deficits today are considered ‘a sin’.” Crazy or not, let’s look at each country in detail:
Current account positions of Asian countries
Source: IMF World Economic Outlook, October 2018
China: Get used to the shrinking surplus
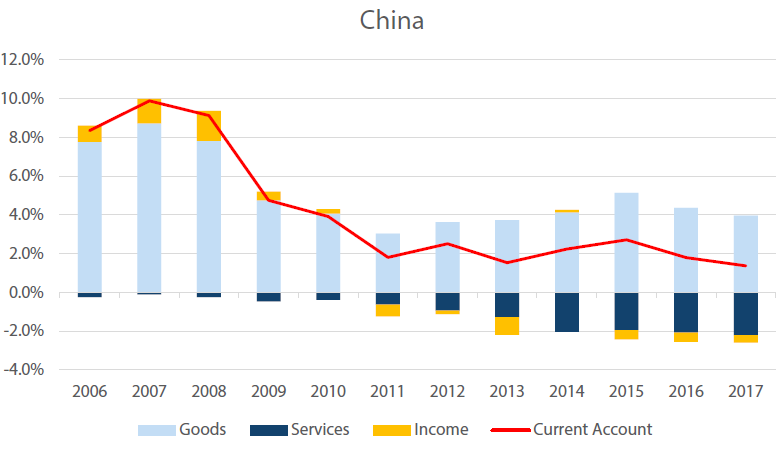
China’s current account surplus has been diminishing since the global financial crisis, which is a reflection of the changing nature of the economy. As the nation tries to rebalance from its past position as the world manufacturer to an increasingly important world consumer, the country’s current account surplus as a percentage of gross domestic product had shrunk from 10% in 2007 to a mere 1.4% in 2017. While China continues to enjoy a large goods trade surplus, as it is still a large exporter of electrical equipment, machineries and other goods all over the world, the country has been posting widening deficits in the services account, prompted by rising Chinese spending on outbound tourism, education and entertainment as well as purchases of foreign technologies and patents.
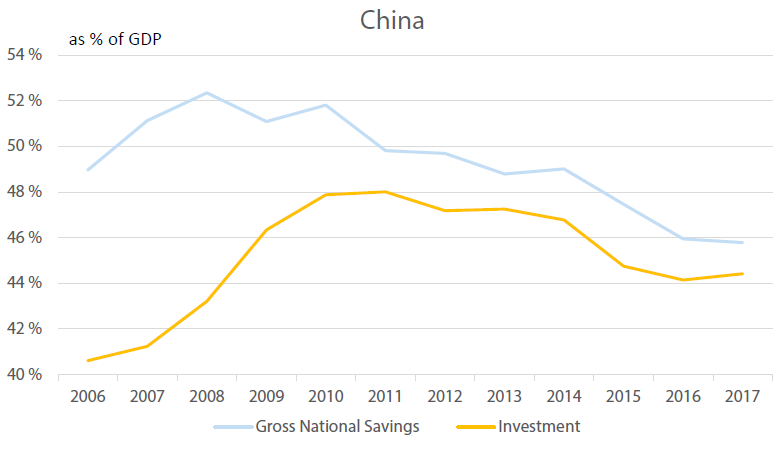
From the savings-investment perspective, the decline in China’s domestic savings can be attributed partly to a stronger social welfare net, increased household consumption, and development of capital markets.
In addition, it is important to watch the other side of the Balance of Payments account, especially whether the financial and capital account has enough buffer to compensate for the shrinking current account trend. So, when we include FDI flows, China‘s basic balance still recorded a surplus in H1 2018 despite the current account weakness seen in the early part of the year.
The IMF projects China’s current account balance at 0.7% of GDP for this year and next year. With US and China trade tariffs kicking in and trade tension likely to stay for the long haul, we wouldn’t be surprised if China’s current account records small deficits in the coming years.
While the CNY may continue to face pressure as a result of the shrinking CA surplus, we however believe that this may not be an indication of economic weakness but rather a sign of the structural rebalancing of the economy towards consumption (especially of services) and towards less reliance on exports.
China’s Current Account, % of GDP
Source : Bloomberg, 2018
China’s Investment vs Savings
Source : Bloomberg, 2018
South Korea: Ageing population comes with higher net Savings
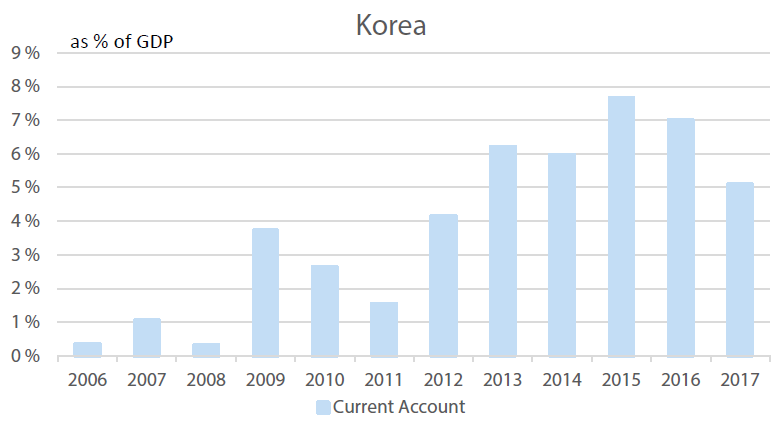
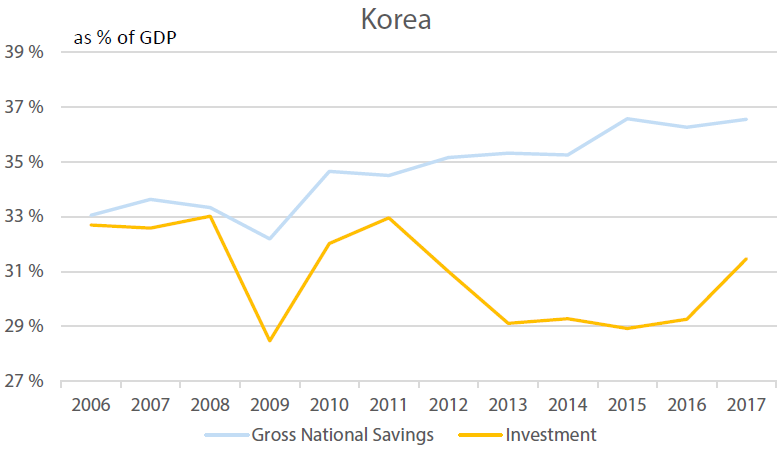
Before the Asian financial crisis, South Korea ran mostly current account deficits, as the country’s investment was generally larger than its savings. But since 1998, Korea has consistently recorded current account surpluses. And as of 2017, South Korea’s current account surplus amounted to the world’s fifth largest. So, what has driven these two decades of surpluses?
From the savings-investment perspective, the substantial current account surplus has been largely attributable to the growth of net domestic savings with the backdrop of an ageing population. On the other hand, non-financial corporates, which are the net borrowers of the economy, have been reducing their net investment, likely due to the lower returns on investment, as the industrialised economy progressed into a mature phase and also because of the shifting of production offshore in search of lower labour costs.
From the trade perspective, Korea has had a relatively diversified profile, which supported the consistent surplus through the years. Semiconductors have increasingly become one of the key export components (about 20% of exports) in Korea. Other components include automobiles, shipping, and steel products. Thus, given the nature of the exports, the tech cycle and smartphone sales strongly affect the trade balance.
The IMF projects Korea’s current account surplus to narrow from 5% this year to around 4.7% next year, as a consequence of the weakening trade environment and slowdown in the tech cycle. In the foreseeable future, we expect Korea to maintain a current account surplus, given the diversified trade nature of the economy and an ageing population.
Korea’s Current Account, % of GDP
Source: Bloomberg, 2018
Korea’s Investment vs Savings
Source : Bloomberg, 2018
Malaysia: Not just about Commodities
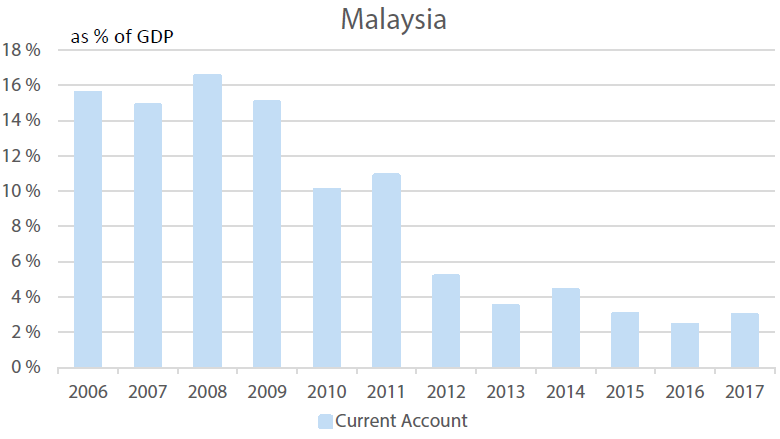
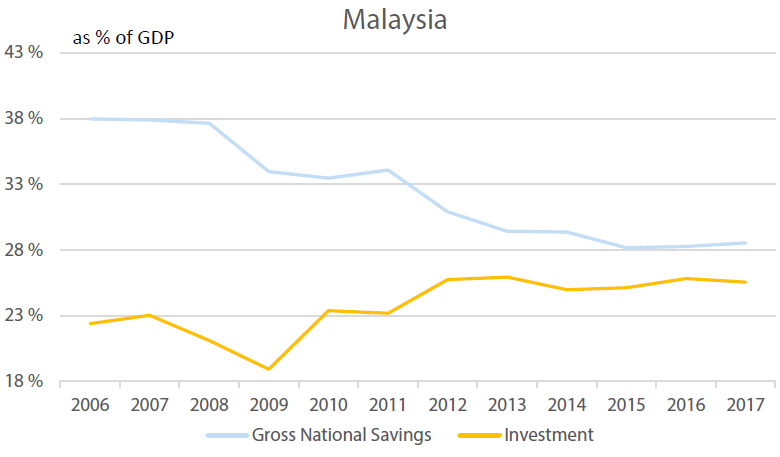
Malaysia’s current account balance has consistently recorded a surplus since the Asian financial crisis, driven mainly by the surplus in the goods account. While commodity exports (palm oil, LNG, rubber) remain a fundamental contributor to trade (17% of gross exports), exports of Electrical and Electronics (E&E) products is in fact a larger contributor, at about 37% of gross exports. Examples of E&E products include semiconductors, circuit boards, audio visual products, computers, computer peripherals and disk drives. Needless to say, like Korea, Malaysia’s trade is sensitive to the global technology cycle, but it’s worth noting that the E&E components mix in Malaysia’s exports tend to be less volatile compared to Korea’s exports (which are generally more sensitive to smart phone cycles).
When it comes to the oil trade, Malaysia stands out as the only country in Asia that is a net exporter of crude oil. However, the terms of trade impact from oil prices is not straight forward because Malaysia is also a net importer of petroleum related products. In any case, Malaysia still stands to be the most resilient country in Asia during periods of rising oil prices and with regards to a high oil price’s impact on current accounts.
The IMF projects Malaysia’s current account to narrow from 2.9% in 2017 to 2.3% in 2018. As the current account balance is diversified among commodities and E&E, a stable surplus is expected going ahead.
Malaysia’s Current Account, % of GDP
Source : Bloomberg, 2018
Malaysia’s Investment vs Savings
Source : Bloomberg, 2018
Thailand: Tourism matters
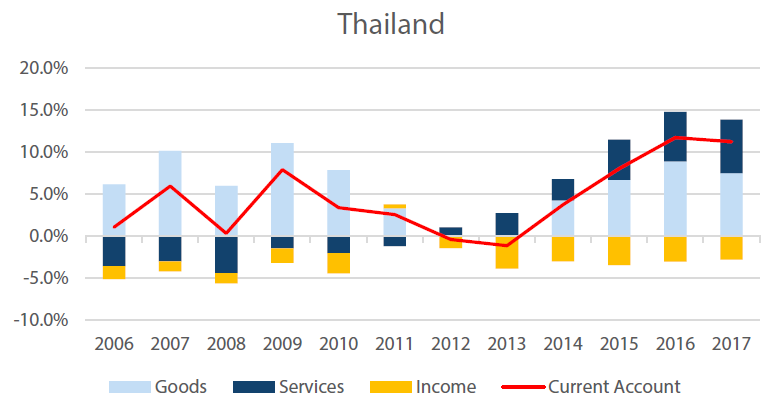
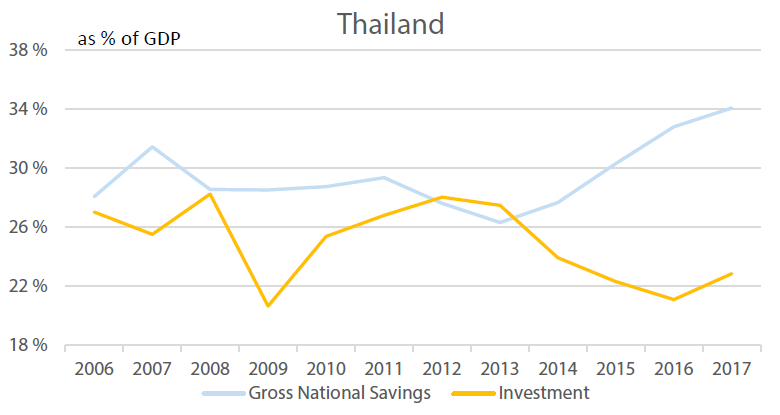
Before the Asian Financial Crisis, Thailand had a current account deficit as high as 8% of GDP. Now, Thailand’s current account is expected to reach an almost 8% surplus this year. The turnaround in the current account since then was achieved at a very high cost, in terms of a severe economic contraction.
In recent years, the current account surplus has seen a massive jump - attributed mainly to a surge in savings, coupled with a decline in investments. The country has been under the rule of its military since 2014, and the political uncertainty has held back private investment.
In terms of trade, like South Korea, Thailand’s exports are relatively diversified. Thailand ranks high among the world’s automotive export industries and electronic goods manufacturers, and is also among the world’s largest exporter of agricultural products, such as rice.
Thailand’s net service exports have shown impressive growth through the years, supported by healthy tourism receipts. The tourism industry contributes about 12% of Thailand ‘s GDP vs 6% seen in 2010. The top sources of visitors are China, Russia and India. In particular, tourist arrivals from China alone account for about 30% of total visitors. That said, tourism from China to Thailand has hit a rough patch in recent months due to tourism incidents onshore.
For 2018 and 2019, the IMF expects Thailand’s current account to register at 9% and 8% of GDP, respectively from about 11% in 2017, as global trade growth moderates and public investment/domestic consumption improves.
Thailand’s Current Account, % of GDP
Source : Bloomberg, 2018
Thailand’s Investment vs Savings
Source : Bloomberg, 2018
India: Too much Oil, too much Gold
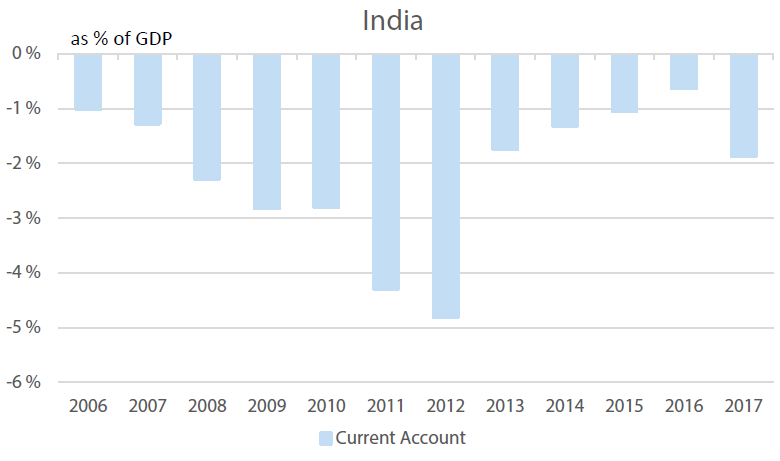
We see India’s current account deficit as an undesirable type--mainly due to the country’s large merchandise trade deficit. As an oil importing country with inelastic demand for oil, India’s current account deficit tends to fluctuate with sharp moves in oil prices. After the Global Financial Crisis, India’s current account deficit widened but experienced a deep reduction after 2013 when oil prices fell.
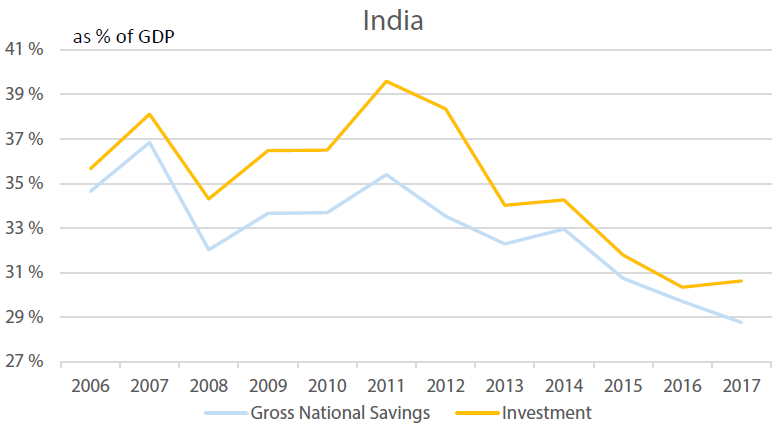
Besides oil, India’s gold imports have also been historically large. Apart from jewellery demand, gold is also used as a hedge against inflation. Hence, fluctuations in gold prices tend to affect the current account as well. The lagging competitiveness of Indian exports (which mainly are petroleum products and gems/jewellery) means export earnings fall short of the huge import bill. Using the savings-investment perspective, both domestic investment and savings ratios have been on a declining trend since 2012. Weak investment may be attributed partly to high debt levels in capital intensive sectors, while investment in high-end real estate has slumped due to a crackdown on speculation. Meanwhile, soft household income growth and poor fiscal finances has weighed down on the savings ratio.
The IMF expects the current deficit in India to widen from 1.9% in 2017 to 3% in 2018 and 2.5% in 2019, on firm oil prices and strong imports. We view the underlying dynamics of India’s current account as unhealthy and likely to continue dragging on the rupee, especially if there is insufficient FDI and portfolio flow to finance the deficit.
India’s Current Account, % of GDP
Source : Bloomberg, 2018
India’s Investment vs Savings
Source : Bloomberg, 2018
Indonesia: Taking care of the Deficit
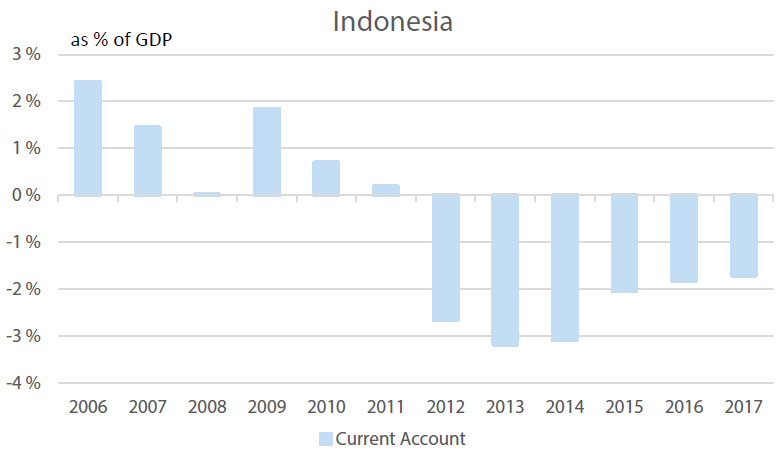
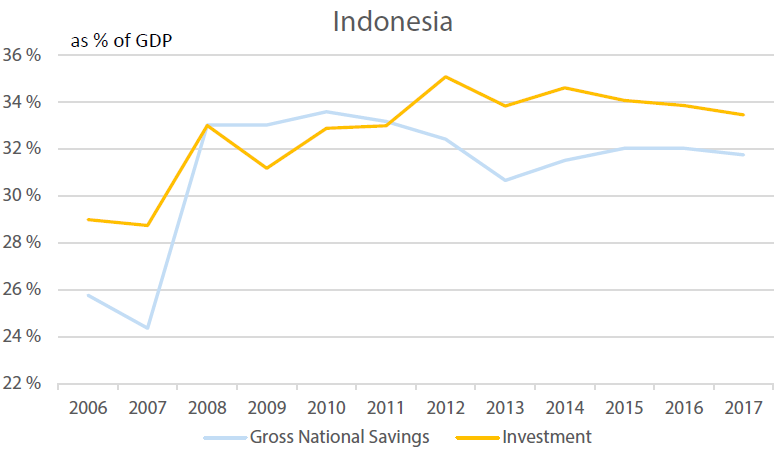
From the Asian Financial Crisis to 2012, Indonesia had been recording current account surpluses. Since 2012, the decline of the current account to a deficit has been driven mainly by resilient domestic demand and investment. As inflows of capital and consumer goods significantly rose, the import bill inflated. And as a major commodity exporter (mainly palm oil, coal, petroleum gas, crude petroleum and rubber), Indonesia’s commodity export revenue declined when commodities prices softened. Another major factor back then that caused the deficit to widen was the country’s oil import bill to support the country’s fuel subsidy programme. However, this problem was then moderated when President Jokowi came into power in 2014 and started his reform policy of liberalising some of the domestic fuel prices by adjusting the subsidies.
In 2018, tighter liquidity conditions have led investors to increasingly focus on Indonesia’s external funding risks because of the current account deficit. Together with the Indian rupee, the Indonesian rupiah has weakened considerably, prompting policymakers to implement various measures to control the current account deficit, such as curbing imports, phasing out infrastructure projects and lastly interest rate hikes by the central bank.
From a current account deficit of 1.7% in 2017, the IMF projects a deterioration of the deficit to around 2.4% for 2018 and 2019, due in part to imports of capital goods for infrastructure projects.
Indonesia’s Current Account, % of GDP
Source : Bloomberg, 2018
Indonesia’s Investment vs Savings
Source : Bloomberg, 2018
Philippines: Build, Build, Build the Deficit
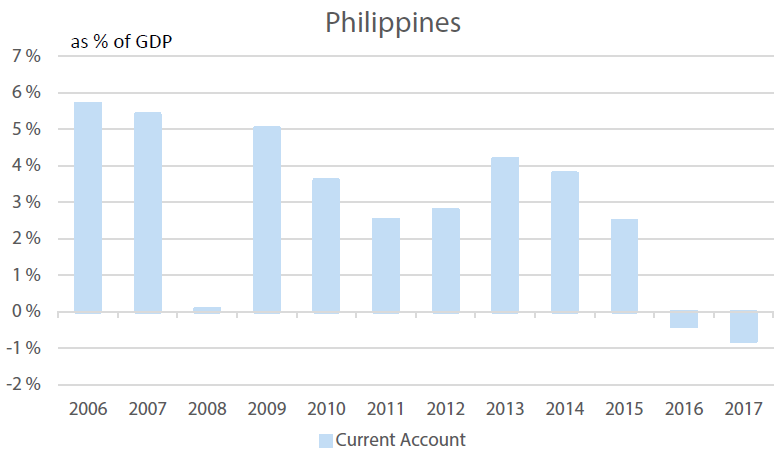
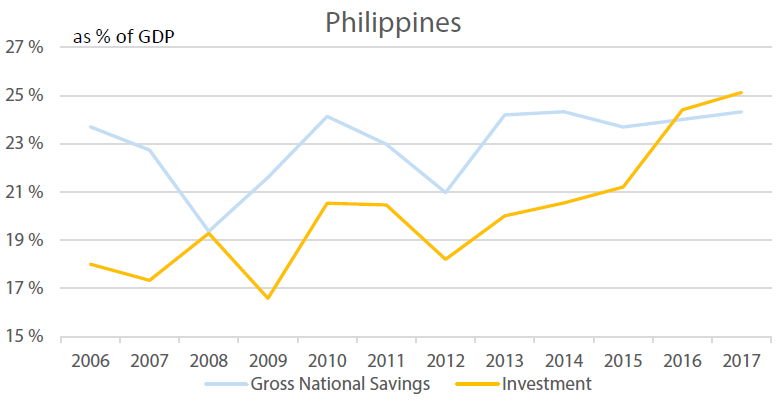
The Philippines enjoyed current account surpluses from 2002 to 2015, supported in part by resilient overseas worker remittances and services exports. However, in 2016, the country recorded a current account deficit, as the Duterte administration implemented public sector infrastructure projects. The government’s “Build, build, build” programme and “Development Plan 2017-22”, which seeks to promote regional growth via greater connectivity, increased the demand for imported capital goods and widened the trade deficit. Consequently, although we expect the country’s savings rate to remain relatively stable, we anticipate that domestic investment needs to continue to outstrip savings at least until 2022.
The IMF expect the Philippines to record current deficits of around 1.4% - 1.5% for the current and coming years up through 2020, as imports of capital goods and raw materials are expected to remain firm.
Philippines’ Current Account, % of GDP
Source : Bloomberg, 2018
Philippines’s Investment vs Savings
Source : Bloomberg, 2018
Conclusion: The Good and the Bad
After a closer look at the evolution of external imbalances of some Asian economies, we argue that these imbalances should not be judged solely by their size. Particularly for countries with current account deficits, we have seen that these often result from investments outpacing savings. As funds are used for productive investment purposes, the country will stand to benefit from increased revenue streams/economic activities in the future, which should be positive for real GDP growth. We would classify the Philippines as the ‘’good deficit’’ type, in which increased infrastructure spending in the country, while eroding the current account, should be beneficial to the country in the long run. On the other hand, we see India‘s current account deficit as the “undesirable deficit’’ type. As a result of India’s current account dynamics, the rupee has always been vulnerable to shocks in oil prices. Also, the slowdown in both investment and savings in the country is likely to be unconstructive for the country’s long term growth.
Likewise, even for the current account surplus countries, while the surplus will support the currency, the nature of the surplus is likely to affect the country’s long term growth potential. For example, in Korea and in Thailand, where the decline in savings is due to ageing populations, together with a fall in investment opportunities, the potential growth outlook is likely to remain suppressed.


