Snapshot
As we wrap up the final weeks of 2018 and look ahead to whatever challenges lay ahead next year, we can’t help but reflect on what has been a testing and frustrating year for investors. Perhaps this year just seemed particularly difficult because of the very favourable markets we experienced in the prior year, or maybe it was the strong sense of optimism and promise we brought into the beginning of the year. Compounding this was the gratifying validation of soaring markets in January, only to be brutally crushed shortly thereafter. Either way, there is nothing like your horse leading at the final turn, only to finish out of the placings at the finish line. It is disappointing, but also emotionally exhausting.
The last two years also had us (strangely) thinking back to one of the highest grossing movies of all time, Titanic. Early in the story, we see the film’s young star standing at the bow of the largest ship of its time and considered invincible, arms outstretched and proclaiming, “I’M THE KING OF THE WORLD”. Much later in the story, we see our young star floating in the icy waters of the North Atlantic Ocean, clinging to a scrap of wood and his life. Even though we are in no way suggesting that markets will meet a similar fate to this infamous voyage, we are certainly familiar with this cycle of euphoria and despair. It is an emotional rollercoaster as 2017-2018 has aptly demonstrated, but we sign up for this because we simply love the ever-changing challenges of investing.
When thinking of the interaction between investing and emotions, one of the oldest and simplest adages of investing comes to mind, “buy low, sell high.” This is particularly fitting for us because of our belief in the importance of valuation in making investment choices. But how can a mantra that is so easy to cite be so difficult to live by? The answer, like so many things in investing, lies in our emotional responses to making investment decisions in real time.
In most cases, when we are considering investing in a “cheap” asset, we are also considering the merits of an unloved asset. Assets often become undervalued because something has gone wrong, or is expected to go wrong, and that has caused investors to sell in the first place. In our experience, these moments will also be accompanied by many “experts” telling us that the asset in question is cheap for a good reason and to stay away. The opposite is also common for “expensive” assets with numerous reasons to believe the sky’s the limit and you’d be crazy to get out now. As investors, we must get used to being second guessed at every turn, from our peers, our bosses, our partners and possibly even our spouses!
When all is said and done, our old friend Harry (hindsight) is likely to drop by for a chat later. Of course that asset was cheap or expensive, he will say. It was obviously a great time to buy or a no-brainer to sell. As tempting as it is to entertain this revisionist history, we know that making investment decisions in real time is always an uncertain business. We can control our decision making processes, but we almost never control the outcomes. Even when Harry tries to tell us otherwise.
For those of us that invest other people’s money for a living, we understand that controlling emotions and understanding our natural behavioural biases is key to our success. This becomes particularly important when markets become volatile and events unfold rapidly. It is through our investment process and remaining disciplined in our decision making that we navigate these biases.
Our best wishes to you and your families and we look forward to navigating markets with you again in 2019.
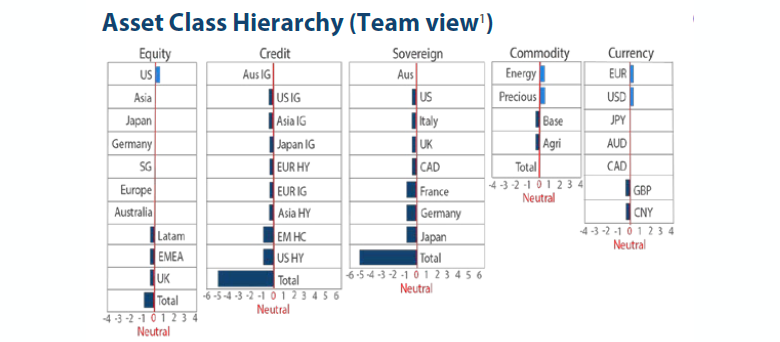
Note: Sum of the above positions does not equate to 0 in aggregate – cash is the balancing item.
1The asset classes or sectors mentioned herein are a reflection of the portfolio manager’s current view of the investment strategies taken on behalf of the portfolio managed. These comments should not be constituted as an investment research or recommendation advice. Any prediction, projection or forecast on sectors, the economy and/or the market trends is not necessarily indicative of their future state or likely performances.
Research Views
We make adjustments to our asset class views and hierarchies as discussed below.
Global equities
We lift Asia ex-Japan equities over Japan this month. The factors driving a more constructive view on the former include an expected pick-up in growth due to China stimulus, a stabilising US Dollar, a more dovish US Federal Reserve (Fed) and a temporary truce in the US-China trade wars.
We still like Japan for having among the most attractive valuations across developed markets and for the secular trend in margin expansion and profitability improvement. Our incrementally more cautious view stems from a downgrade to scores on monetary policy and earnings outlook. We expect the Bank of Japan to inch closer to adjusting its pace of monetary easing next year to mitigate some of the unpleasant side effects that it has had on the banking system. The earnings outlook has deteriorated recently too. Our colleagues from the Japan equities team downgraded their earnings growth expectations for FY 2018 to get closer to the 5% earnings growth currently expected by consensus. Notably consensus earnings growth momentum has decelerated sharply over the last four weeks too.
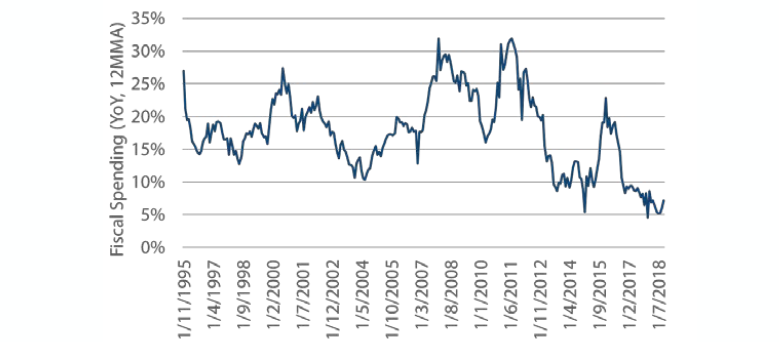
On the other hand, we expect that through careful fine tuning, China will find the right policy mix to lift growth in Q1. This will likely be more derived through local demand, given the emphasis on consumption and less on infrastructure investment. As shown in Chart 1, China has ample fiscal room to support this expansion given the last couple of years of deleveraging and de-risking.
Chart 1: China fiscal spending
Source: Bloomberg, November 2018
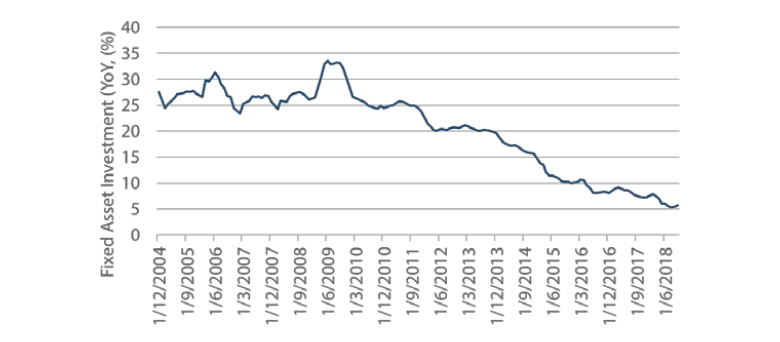
Even on infrastructure there may be room for some upside surprise. Targeted infrastructure spending could be employed to mitigate growth risk from further escalation in trade wars. As shown in Chart 2, fixed asset investment has been a secular downward trend over the last few years. As such any stabilisation will be stimulatory to growth.
Chart 2: China fixed asset investment trends
Source: Bloomberg, November 2018
With stimulus-induced growth waning in the US and the end of Fed tightening within sight, the dollar is likely to stabilise and perhaps weaken at the margin.
Last, but not least, the recent G20 summit between Trump and Xi concluded with a temporary ceasefire. The US will stop imposing additional 15% tariffs on USD 200bn of China imports from Jan 1st. Both sides will have 3 months from Dec 1st to hammer out a trade agreement. The concessions made by China suggest that reaching a comprehensive agreement between the two sides is a definite possibility. Such an outcome would benefit all equity markets by putting a floor under growth risks. However the greatest outperformance may come from China and Asia ex Japan markets where risk appetite currently is lowest.
Global bonds
While Australia continues to be our preferred Sovereign bond exposure, we have downgraded UK Gilts to now sit below the US and Italy within our neutral group.
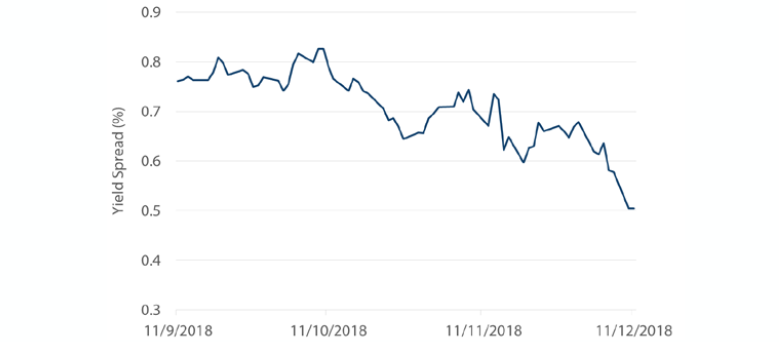
Much like Italy, the UK is in the midst of an event that could have a significant impact on both its shorter and longer term fortunes. When the UK public delivered a “leave” verdict back in 2016, patriotic sentiment rose to the fore and pushed the practicalities of leaving the European Union (EU) to the background. Move ahead to today and it is now all about the details and the terms of the divorce, which can only be described as messy. The uncertainty swirling around the future relationship between the UK and Europe has certainly lent a safe haven bid to Gilts and greatly reduced market pricing for future rate hikes by the Bank of England. As a result, 10-year UK Gilts have outperformed French OATs by 25 basis points (bps) over the last three months.
Chart 3: 10-year UK less France spread
Source: Bloomberg, December 2018
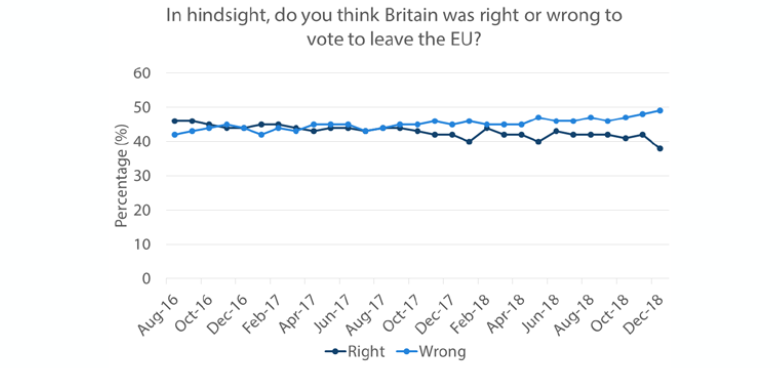
As frustrating as it may be to try and follow the many political plotlines that interweave the Brexit negotiations, we suggest that there is one key issue that we must focus on: the border between the Republic of Ireland and Northern Ireland (part of the UK). This has become an intractable problem that is contributing to uncertainty, and this confusion appears to be registering with the UK public. A series of YouGov polls conducted in the UK from 2016 to now, show that buyer’s remorse is setting in for many who voted to leave the EU. Shortly after the referendum, 46% thought leaving was the right choice while 42% thought it was the wrong choice. The latest poll in December showed a reversal with 49% now thinking it was the wrong choice versus 38% thinking it the right choice.
Chart 4: YouGov Brexit Poll
Source: WhatIKThinks.org/EU run by NatCen Social Research, December 2018
Our assessment of the current situation is that the probability of the UK eventually changing course and remaining in the EU is rising rapidly. The inability of those supporting a hard Brexit, and return to WTO trade rules, to address the border question, leaves this option as the least likely in our estimation. The soft Brexit camp also has its problems trying to explain why the UK should continue to be bound by many of the EU’s rules while giving up its seat at the table. In market terms, either a soft Brexit or no Brexit should be positive for the Pound and negative for Gilts. The risk of course is that UK falls out of the EU without a deal which would be negative for the Pound and stoke safe haven flows into Gilts.
Global credit
The recent widening of credit spreads has led a number of credit markets to see their valuation scores improve. We started the year with almost every single credit market showing double negative valuations on spreads. Today, the average valuation is neutral to positive. US Investment Grade (IG), EU IG, EU High Yield (HY) and Asia IG, all saw spreads move from negative to neutral valuations this month. US HY saw spreads move from double negative to negative and Asia HY moved from neutral to positive. As such, we move Asian IG up the hierarchy to joint second with US IG, plus upgrade EUR HY and Asian HY.
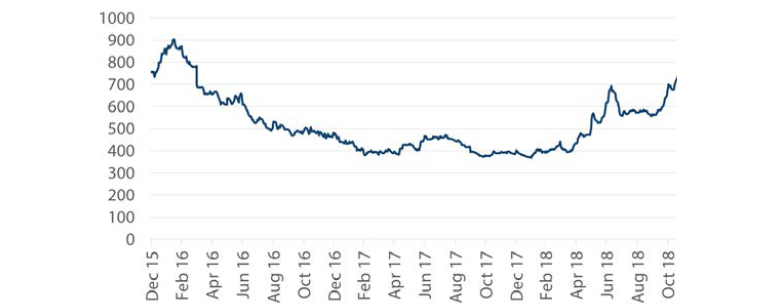
We have long been negative on high yield, particularly due to record tight spreads and deteriorating fundamentals. However, outside of the US, Europe and Asia appear to be showing signs of affordability. Asia high yield spreads have blown from 400bps in January to over 700bps in December and score cheap on our valuation metrics. However, as discussed in the opening, cheap assets are typically unloved for a reason. Asian HY has seen spreads blow out over 1000bps in the past, so current spreads are far from capitulation levels, but close to the highs of early 2016. The index is also predominantly weighted towards Chinese construction and industrial companies, which are being squeezed during the government’s deleveraging campaign. While we are excited to see a cheap reading in high yield, we remain wary of Asia HY until we see signs of relief. Signposts include a reprieve from deleveraging by the Chinese government, stabilising/weaker USD and a general improvement in market sentiment towards emerging markets.
Chart 5: Asia HY Option Adjusted Spreads
Source: ICE BofAML, Bloomberg, November 2018
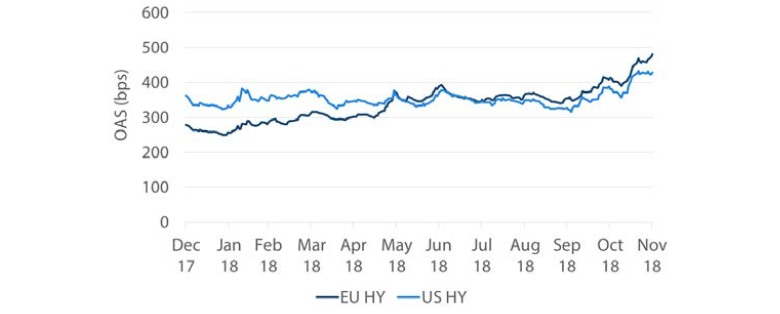
European HY does not show the same strong valuation support, but has since flipped to neutral by our metrics. EU HY now offers 50bps higher all-in hedged yield above US HY. While the US macro outlook is brighter than that of Europe, the credit fundamentals of EU HY corporates actually outshine their American counterparts. European HY corporates used their increase in profits to pay down debt, rather than to lever up as has been the case in the US. Leverage (as measured by Net Debt to EBITDA) has remained range-bound at around 2x since 2011, whereas US HY leverage has jumped from below 2.5x to over 3.5x. European HY corporates are also in a stronger position to weather higher rates, with EBIT to Interest Expense rising from below 2 in 2012 to above 4 now, whereas US HY corporates have deteriorated from 3.5x to around 3.1x over the same period. While Europe is set to see slower growth, removal of central bank stimulus and increasing volatility over Italy, fundamentals remain strong and yields are starting to look more attractive.
Chart 6: US vs EU HY Option Adjusted Spreads
Source: ICE BofAML, Bloomberg, November 2018
FX
We lifted EUR to top of the hierarchy, mainly on account of a shift in view on USD. We also lifted AUD above CAD, driven by the relative performance of the commodities that they export.
November delivered a clear inflection point in Fed policy. Whereas a month ago, it appeared the Fed had a long way to go, now it looks like tightening cycle is coming to an end, perhaps in 2019. This conclusion comes through tortured analysis of nuanced language by the Fed, but the gist is enough to keep USD on the back foot until the Fed perhaps turns more hawkish again.
Also, the relative strength of US economic growth over the rest of the world may also be coming to an end. As the impetus of fiscal stimulus wears off and growth picks up elsewhere – think China given its stimulus efforts to date – there is scope for USD to remain weak.
The risk to this USD view is tighter global liquidity could lead to a deeper dollar shortage should it force deleveraging of dollar borrowers. Also, we keep an eye on the potential escalation of trade wars, but despite market volatility questioning the strength of any deal, the truce from G20 is still good news on this front.
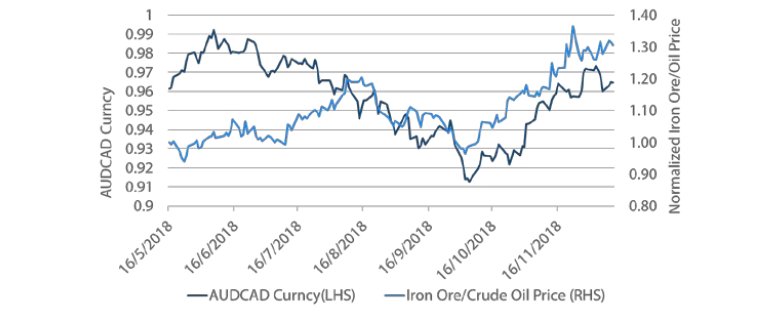
The relative policy stance favours CAD over AUD, given the more hawkish Canadian central bank, but since Canada is a large exporter of oil and oil prices have fallen quite considerably, it is important to consider the relative change in terms of trade. Chart 7 shows the AUDCAD cross versus the price of iron ore (Australia’s main export) over oil. Clearly, the fall in the price of oil has had a considerable impact on CAD. Given the change in the terms of trade, we lifted AUD above Canada in the hierarchy.
Chart 7: AUD/CAD exchange rate against iron ore/oil price
Source: Bloomberg, December 2018
Commodities
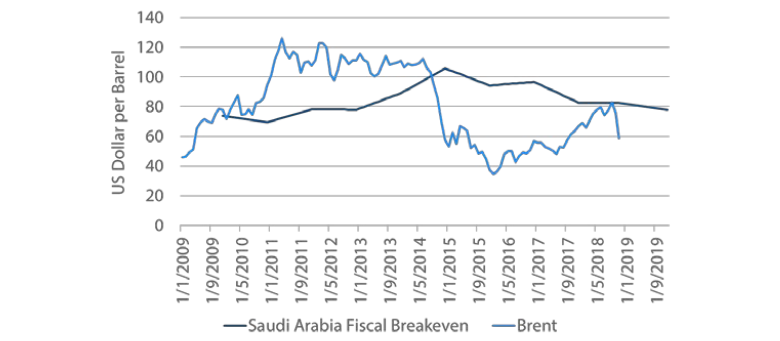
On 8 December, OPEC and Russia announced that they will remove 1.2 million barrels of production from market, aiming to restore supply and demand back to balance. The decision defied President Trump’s pressure for OPEC to open the taps and keep oil prices low. The correction has been straining OPEC countries’ fiscal buffer, as shown by Saudi Arabia in Chart 8, with potentially severe social consequences.
Chart 8: Saudi Arabia fiscal breakeven oil price
Source: Bloomberg, December 2018
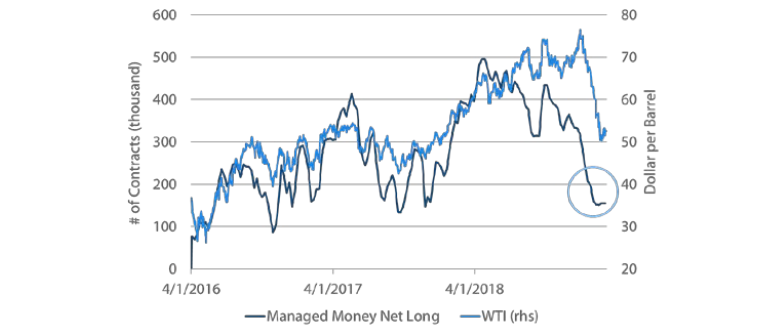
News from Canada also helped lift sentiment in early December, as the Alberta government was reported to curtail oil production due to pipeline constraints. According to Energy Intelligence Group, Canada is the fifth biggest oil production country after US, Russia, Saudi Arabia and Iraq, and thus the market was caught off guard. This is on top of the loss of production in Venezuela and Iran which are set to worsen next year. Given how lightly the market is positioned, the relief rally could last for some time.
Chart 9: Speculative positioning in WTI
Source: Bloomberg, December 2018
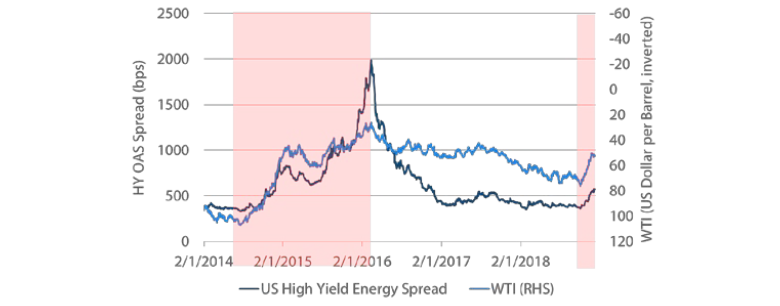
However, the long term dilemma OPEC and Russia are facing is that they are going to lose market share with the production cut. The French riots have widened spreads for leveraged shale producers, however, this appears mild compared to the previous crash. The floor could encourage them to ramp up production and cap the rally.
Chart 10: US Shale Producer Spread
Source: Bloomberg, December 2018
Process
