Snapshot
The return of negative bond/equity correlations was a rare silver lining for multi-asset investors in 2018. In December, bonds rallied and stocks corrected with Treasuries (+2.3%), Gilts (+2.4%) and Bunds (+0.6%) posting strong gains while equity markets in the US and Japan (-10% each) led a broad based equity sell off that also extended to Europe (-5%) and Emerging Markets (-2.8%). The risk-off tone was also evident in the performance divergence of safe havens such as Gold (+5%) and Silver (+9%) and the more cyclical risk exposures of Copper (-5%) and Oil (-10%). Credit markets saw a significant repricing with spreads on US high yield bonds widening by over 100 basis points (bps).
A negative correlation between bonds and equities augurs well for multi-asset diversification. For much of the last couple of years many investors, us included, have fretted that this correlation might be about to turn positive as bond yields rise while stocks correct. However market concerns around slowing global growth in the last few weeks of 2018 ensured that bonds rose as stocks fell. As long as growth and inflation remain the driving narrative in markets we expect this negative correlation to endure and provide effective downside risk protection to diversified, risk-balanced multi-asset portfolios.
Another reason for us to look to 2019 with some optimism is the improved valuations of equity markets. 2018 was a turbulent year for most asset classes. Chinese equities led losses for the year with the Shanghai Composite shedding over a fifth of its value on the back of slowing growth and a multitude of investor concerns ranging from trade wars to deleveraging. Slowing European growth and messy politics led to a correction in broad European equities (-10%) while a Q4 correction saw the end of US exceptionalism. The S&P 500 finished the year down 4.4% on the back of a greater than -10% peak-to-trough drawdown. Technology and Industrial stocks endured a drawdown more than twice as deep.
As a result of these market corrections, equity valuations have improved significantly. For the US equity market for example, price-to-earnings multiples improved in 2018 by more than five points based on both trailing and 12-month forward consensus earnings, to 17x and 15.4x respectively.
Our empirical analysis of US equity market performance over the last five decades suggests that the odds are greater than 75% for US equities to deliver positive returns in a year that starts out at these valuation levels. Valuations are even more supportive in other developed markets and many emerging markets, notably in Asia, which now constitute our preferred equity exposure globally.
While we acknowledge that the rolling over of US and global economic growth poses some risk to corporate earnings, we are encouraged by our research that reveals a much weaker correlation between economic growth and earnings, than between growth and equity market multiples. In other words the valuation reset of 2018 may already have discounted much of the slowdown expected for this year.
Furthermore, bad news could once again become good news if slowing growth, tightening financial conditions and market volatility prompt the US Federal Reserve (Fed) to pull back from its twin monetary tightening measures of a higher Fed Funds rate and quantitative tightening.
Aside from the above, we believe five key themes will drive markets this year: a stabilising dollar, fiscal and monetary stimulus in China to support growth, a morphing of the US-China trade war into a longer term technology cold war which trades off near-term upside for longer-term risks, continued uncertainty in Europe and pockets of stress in financial markets from tight liquidity.
Asset Class Hierarchy (Team view1)
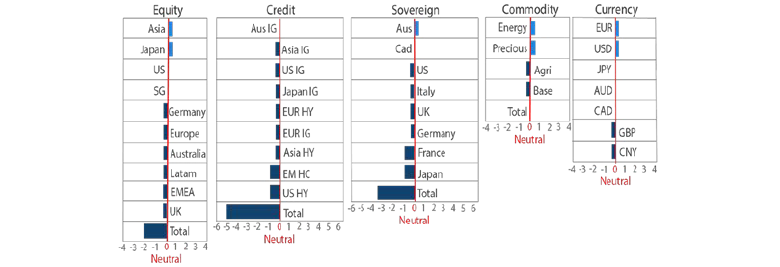
Note: Sum of the above positions does not equate to 0 in aggregate – cash is the balancing item.
1The asset classes or sectors mentioned herein are a reflection of the portfolio manager’s current view of the investment strategies taken on behalf of the portfolio managed. These comments should not be constituted as an investment research or recommendation advice. Any prediction, projection or forecast on sectors, the economy and/or the market trends is not necessarily indicative of their future state or likely performances.
Research Views
We make adjustments to our asset class views and hierarchies as discussed below.
Global equities
Asia ex-Japan equities return to the top of our equity hierarchy in a continuation of their upward move over the last few months. The underlying factors remain the same: an expected pick-up in growth due to China stimulus, stabilising US Dollar, a more dovish Fed and a temporary truce in the US-China trade wars.
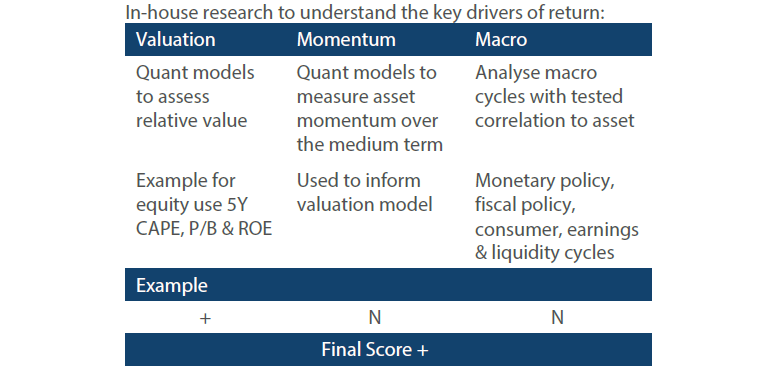
We retain Japan in second place for attractive valuations and exposure to any resolution in US-China trade tensions. This does mean that US equities sustain a double downgrade to third place. In spite of the improved valuations, US equities are still ranked negative on our valuation models. Momentum too turned negative last month and our macro scores for monetary policy and earnings were both trimmed back a notch.
Through recent conversations with clients and colleagues we are reminded that the more important call on equities for 2019 might be whether to downgrade the asset class as a whole, rather than views on relative performance. Equities are included within multi-asset portfolios to provide exposure to growth. Hence investor concern around slowing economic activity is certainly valid.
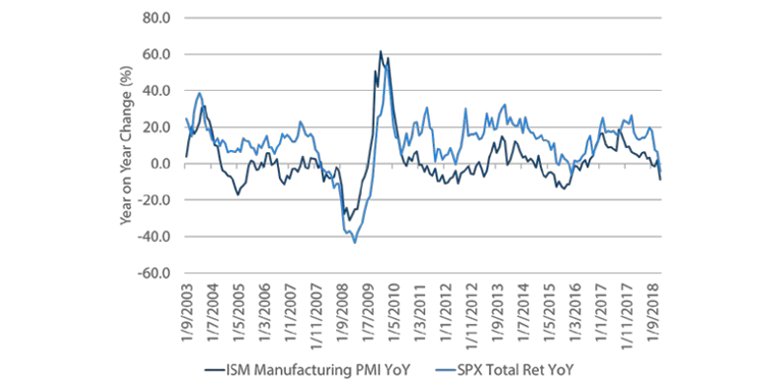
Chart 1 shows the tight linkage between economic activity, using the ISM Manufacturing PMI survey as a proxy, and US equity market performance historically. The sharp slowdown in PMI surveys looks concerning.
Chart 1: ISM Manufacturing Survey and S&P 500
Source: Bloomberg, December 2018
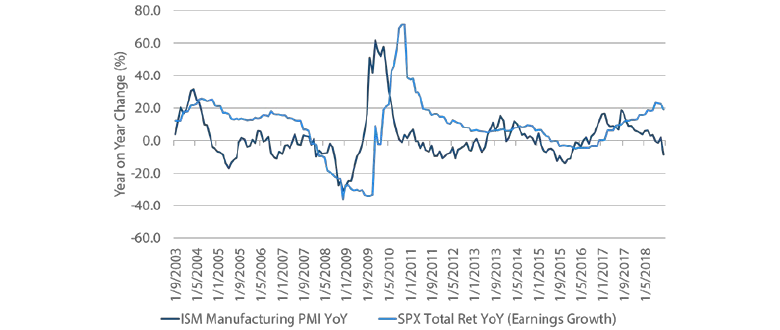
However it is instructive to look at correlations of the ISM index with the individual components of equity market returns: earnings growth and valuation multiples. To do this we run a standard returns decomposition analysis to attribute performance over any period into the earnings growth over that period and the change in equity market multiple. The following two charts show the relationships between the ISM surveys and the two components individually.
Chart 2: ISM Manufacturing Survey and S&P 500 earnings growth
Source: Bloomberg, December 2018
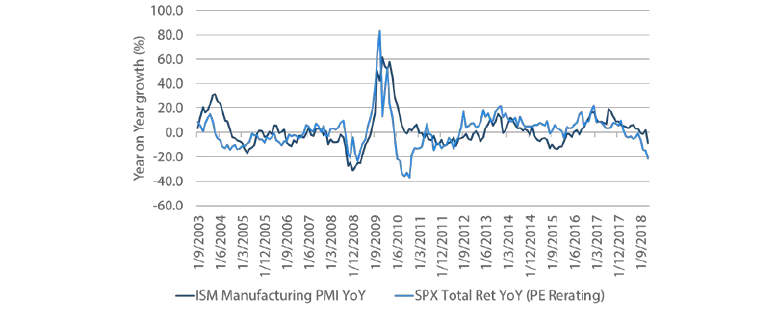
Chart 3: ISM Manufacturing Survey and S&P 500 valuations
Source: Bloomberg, December 2018
We make two observations.
First, the relationship between economic activity and earnings growth is weaker than that between economic activity and valuation multiples. The correlations of ISM with earnings over the period of our analysis are 18% using trailing earnings and 38% using 12-month forward consensus earnings, while the correlation with multiple changes is over 50%. This is not surprising given the forward-looking nature of equity markets and confirms that any potential slowdown in growth is discounted well in advance by market participants.
Our second observation confirms our confidence in current valuation levels. As shown in Chart 3, the multiple de-rating may have overshot the slowing economic activity.
The analysis provides us with an anchor to continue to maintain a moderately constructive view on global equities as an asset class in spite of growth concerns. Any reversal in the tightening of liquidity or backstop to growth would only serve to further increase the upside from owning equities.
Global bonds
Canadian sovereign bonds see an upgrade on our momentum models and a marginal improvement on our macro scores driven by a less concerning inflationary outlook. This lifts them up our sovereign bonds hierarchy to second place, just under Australian sovereigns.
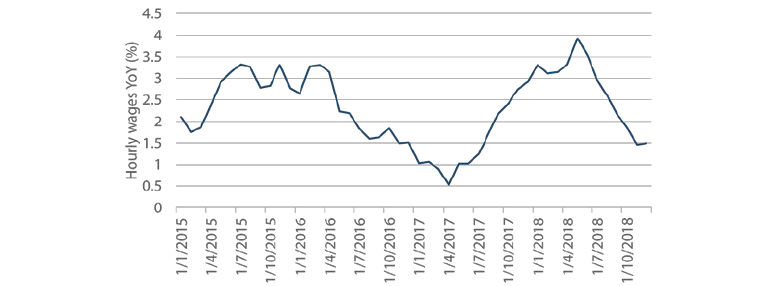
As shown in Chart 4, wages peaked mid-year and have retreated to below 2%, the official inflation target of the Bank of Canada (BOC). The BOC held rates at its 5th December meeting but the statement was more cautious on the outlook. The market immediately pushed the probability of a rate hike in the January meeting from 60% to less than 5%.
Chart 4: Canada average hourly wages (year-on-year)
Source: Bloomberg, December 2018
Aside from retaining Australian sovereigns at the top, we also retain a neutral view on sovereign bonds in the US, Italy and UK and a relatively more cautious outlook on sovereign bonds in Germany, France and Japan.
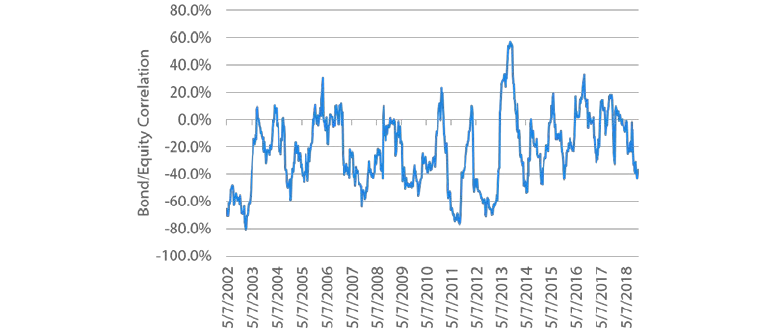
Similar to the big question around equity allocations is the big question around bonds. Many late cycle concerns around inflation and further rate rises remain intact while bond yields have rallied sharply. Does it make sense to hold sovereign bonds in such an environment at all? As we alluded to in the introduction, we certainly think so. Chart 5 plots the rolling six-month correlation between global sovereign bonds and global equities. This has plunged from a recent high of +20% to a low of over -40% illustrating the benefits of owning high quality sovereign bonds with some yield support as a risk diversifier to equity allocations.
Chart 5: Bond/equity correlations
Source: Bloomberg, December 2018
Global credit
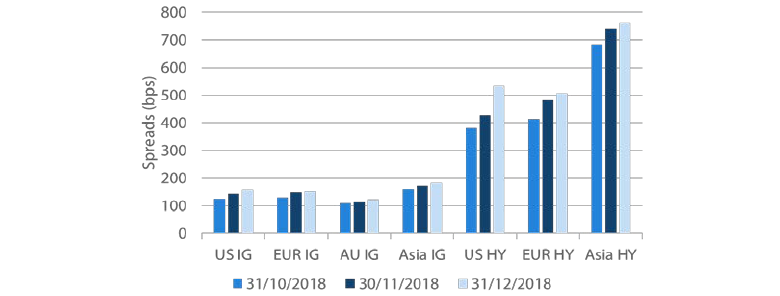
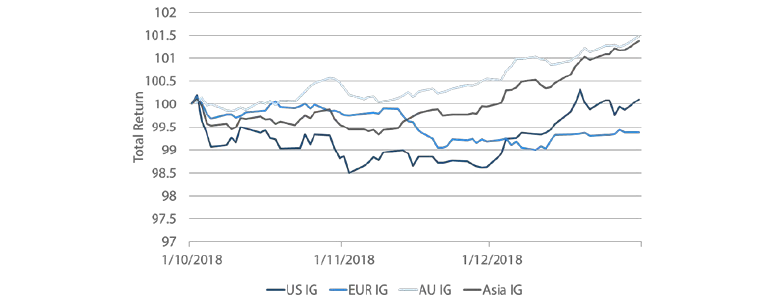
Credit spreads continued to widen in December as risk-off sentiment dominated markets. However, thanks to the underlying sovereign rally, credit performed well overall. Investment grade (IG) spreads widened between 5bps at the low end for EU IG to 15bps at the high end for US IG. Despite this, US IG saw a total return of 1.5% over the month. High Yield (HY) on the other hand suffered, with US HY widening by 104bps, losing over 2% in total returns over the month. Asian HY widened by 20bps but managed a total return of 1.6%.
Chart 6: Option adjusted spreads
Source: ICE BofAML, Bloomberg, December 2018
Despite spread widening, we have downgraded US IG as the underlying sovereign yield has moved from neutral to expensive by our measures. The strong rally in rates has led to a solid return in US IG over the period. We still believe there is further room for spreads to widen and perhaps for underlying sovereign yields to rise from here, so we are downgrading US IG below Asia IG, where we believe the higher spread and lower duration will benefit the asset class more.
Chart 7: IG total return over last 3 months
Source: ICE BofAML, Bloomberg, December 2018
FX
2018 will mostly be remembered as the year where US growth outpaced the rest of the world, allowing US monetary policy to continue tightening while other developed economies remained accommodative. As such, the US dollar, despite weakness earlier in the year, outperformed most other currencies. Countries which financed themselves from cheap dollar borrowing were the hardest hit, particularly those with twin deficits such as Argentina and Turkey. However, the sell-off soon hit the rest of the emerging markets complex, along with those considered proxies such as the AUD. We believe a strong USD and continued US monetary tightening are unlikely in 2019, so are becoming more constructive on EM FX.
There are a number of reasons for our EM FX views. First, the shift in policy stance by the Fed and slowing growth in the US will allow the dollar to weaken, which is a natural tailwind for global risk assets such as EM. Second, the US and China are finally serious about getting a trade deal done, which should help improve investor sentiment. Third, while data continues to remain weak – particularly in China – continued adjustments to policy are likely to add to growth in the coming quarters. We believe EM FX may have bottomed in early September, but we still expect the recovery to be bumpy. With local currency bonds offering far higher real yields than their developed market counterparts, we believe investors may start rotating towards EM throughout 2019.
Commodities
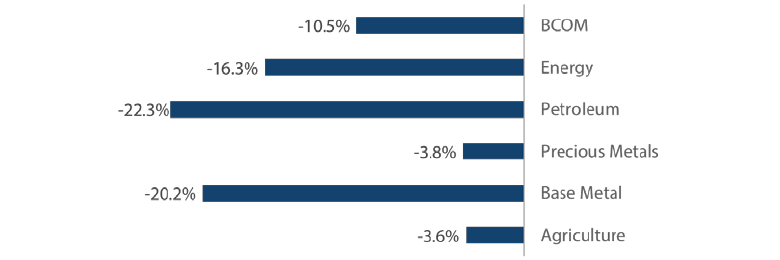
As sentiment became very bearish in December, the fortunes of commodities diverged following the classic playbook – everything was sold off except precious metals, when safe havens were bid up. For 2018, the complex as a whole finished in negative territory, as shown in Chart 8 below.
Chart 8: 2018 commodity spot performance
Source: Bloomberg, December 2018
The crude oil market was dominated by supply news headlines for much of 2018, as US sanctions against Iran drove up supply fears and OPEC+ responded to boost production. The market was disappointed when US granted temporary waivers for countries to continue to import from Iran. The sell-off was violent when huge speculative positions winded down. The outlook for 2019 is more sanguine from here after the adjustments. On the supply side, OPEC+ has committed to production cuts with the possibility to extend in 2019, while production losses from some countries continue, and Iranian waivers expire. On the other hand, US growth is expected to remain above trend, and China is providing more stimulus to the economy amid easing tariff fears. Crude oil should therefore be supported by demand in the near term.
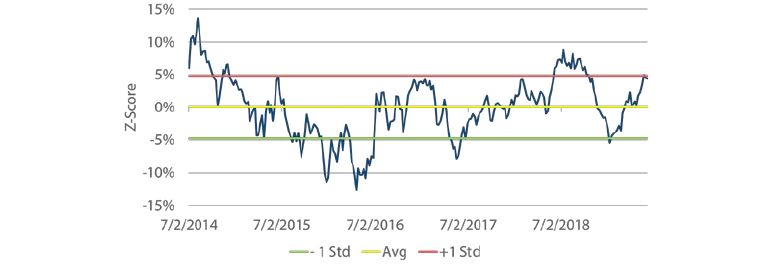
After the rally, gold appears expensive, when compared to real yields. However, as the Fed is turning more dovish, we are less certain of real yields expanding from here, while dollar weakness is a tailwind for gold. There is still risk of a policy mistake which makes gold a reasonable hedge.
Chart 9: Gold versus real yields
Source: Bloomberg, Nikko AM, December 2018
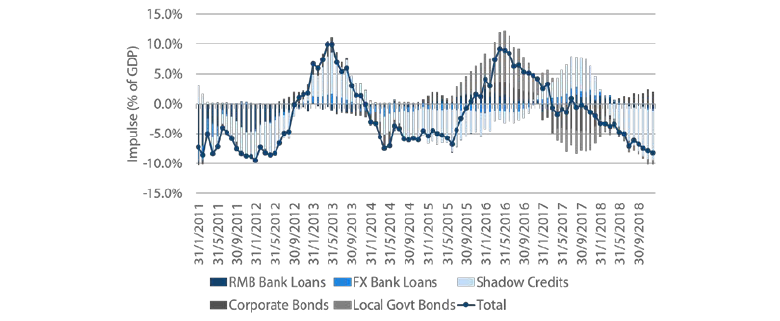
Base metals had a rough year in 2018. Investment growth slumped in China as shadow credits were squeezed, and trade tariffs worsened sentiment. At the time of writing, headwinds are turning into tailwinds for base metals, as the Chinese government is boosting stimulus and trying to stabilise infrastructure spending. More positive news are also emerging from trade negotiations. The latter should also benefit agriculture when China resumes imports of US agriculture products.
Chart 10: China credit impulse
Source: Bloomberg, Nikko AM, December 2018
Process
