Snapshot
As if to be sure markets understood, Chairman Powell of the Federal Reserve (Fed) sounded remarkably and almost emphatically dovish in a press conference at month-end, to suggest that the tightening cycle might be over and even the run-off of the Fed balance is under review for potential adjustment. The Fed has effectively walked back all hawkish comments, including its October statement that rates were “a long way from neutral” and in December that the Fed was comfortable with the run-off of the Fed balance sheet remaining “on autopilot”.
Some have called Powell’s pivot a rookie mistake, basically for sounding too hawkish in the face of rising volatility that threatens animal spirits and the real economy. This may be right, but to some extent one has to wonder – what does the Fed know that we don’t?
Our view is that excessive hawkishness was unnecessary in light of increasingly tight financial conditions against slowing growth in the US and still stubbornly weak growth in the rest of the world. So the Fed did the right thing, but the degree seemed excessive.
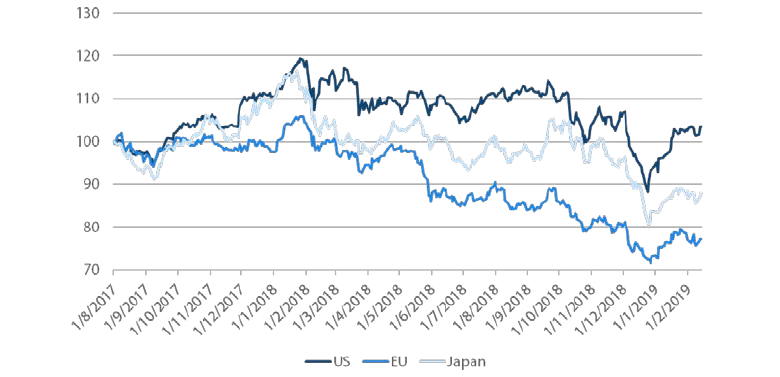
Risk assets had already recovered quite significantly from the Christmas Eve low, with Asian equities recovering +8%, Japan +11% and the US +15% in USD terms, before Powell even spoke. As one would expect, credit spreads compressed. Unusually, so did bond yields, presumably because the Fed’s dovish comments placed an effective ceiling on rates – unless and until growth surprises to the upside.
In our 2019 outlook, we projected that markets could remain bearish despite the potential for many of 2018 headwinds turning to tailwinds for 2019. Such tailwinds include the Fed’s dovish turn, a weaker dollar, a likely trade deal to avert tariffs and China stimulus eventually kicking in growth by Q2 or Q3, but markets have now aggressively priced this positive news, where a negative surprise could return panic and a bout of profit taking.
Case in point, markets have assumed a trade deal will get done. We long argued this point on the premise that it is simply politically prudent to avoid the deeper costs of an inevitable downturn across both countries. Trump did not seem to realise there was any downside until US equities finally buckled in Q4, causing him to significantly ratchet down his rhetoric and return to the negotiating table.
However, while Trump has an election to worry about, Xi does not, and it is possible that Xi may feel he is gaining the upper hand given the newly sensitised Trump to S&P volatility. In any case, given the brinksmanship witnessed throughout 2018, it is not hard to imagine another round to lift volatility before the dust settles, which we still believe will avoid further tariffs. Nevertheless, some downside protection to smooth the journey to the other side could make sense.
Separately, we note the China credit impulse has begun to lift with credit finally flowing to the private sector which has been unduly squeezed by the shadow banking crackdown. While China stimulus will fall far short of prior credit bonanzas, the milder version that balances investment and consumption with less credit slippage will still help to spread modest growth improvements across the region and around the world.
Asset Class Hierarchy (Team view1)
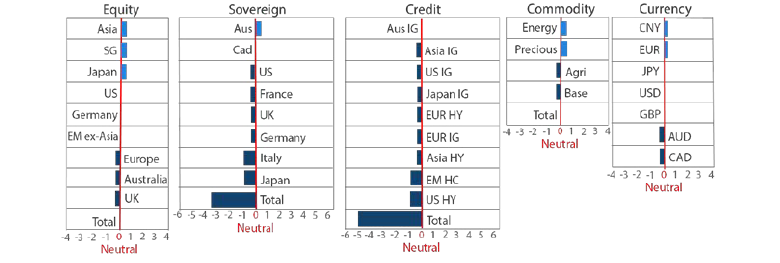
Note: Sum of the above positions does not equate to 0 in aggregate – cash is the balancing item.
1The asset classes or sectors mentioned herein are a reflection of the portfolio manager’s current view of the investment strategies taken on behalf of the portfolio managed. These comments should not be constituted as an investment research or recommendation advice. Any prediction, projection or forecast on sectors, the economy and/or the market trends is not necessarily indicative of their future state or likely performances.
Research Views
We make adjustments to our asset class views and hierarchies as discussed below.
Global equities
Emerging markets (EM) ex-Asia see a double upgrade on our equities hierarchy this month. We are now more constructive on EM ex-Asia relative to both Europe (ex-Germany) and Australia. UK equities remain bottom ranked due to negative momentum and clouds of Brexit uncertainty. The stresses in Turkey and Argentina last year were a good reminder of how heterogeneous EM markets remain. Hence abstracting views to a higher level is not without attendant risks. However differences in fundamentals, risk drivers and market performance across the major regional blocs of Asia, Europe, Middle East and Africa (EMEA) and Latin America (LATAM) do offer some latitude for regional calls.
Chart 1: Relative performance of financial stocks
Source: Bloomberg, January 2019
Our upgrade of EM ex-Asia follows on the heels of our upgrades to EM Asia which had moved to the top of our hierarchy last month.
EM ex-Asia too stands to benefit from many of the same tailwinds enjoyed by EM Asia such as a weaker dollar, a truce on tariffs and returning growth to China. We were relatively more concerned for the region given tight liquidity conditions and political instability.
However the dovish turn of central banks over the last month and easing in financial conditions has alleviated some of the liquidity related concerns. The recent outperformance of financial stocks suggests improving financial market liquidity.
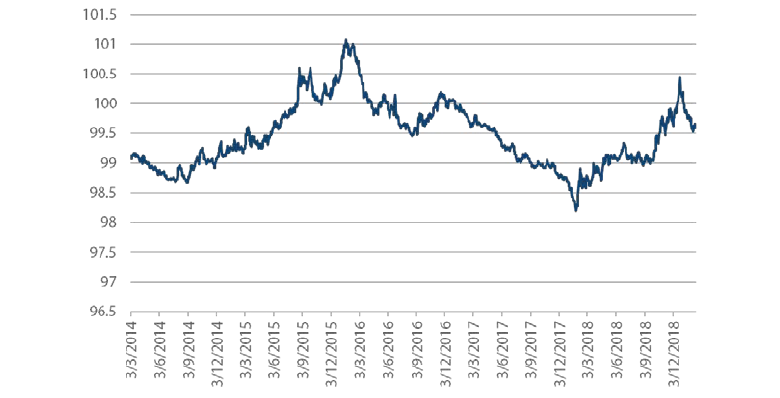
The easing in financial conditions has come from a tightening in credit spreads and higher equity markets and can be seen in the GS US Financial Conditions Index in Chart 2.
Chart 2: GS US Financial Conditions Index
Source: Bloomberg, January 2019
On political risk, EMEA does remain a mixed bag but we are encouraged to see Latin American politics is on the mend.
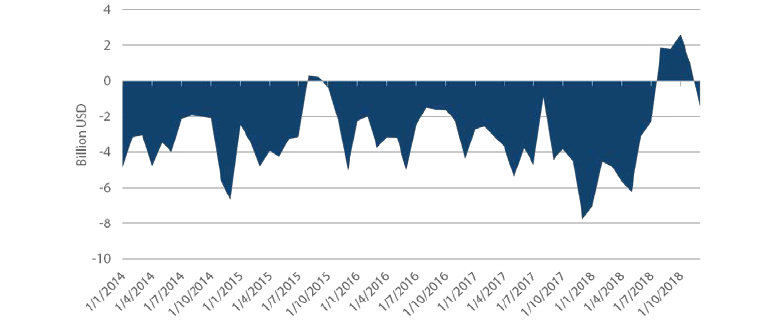
Turkey remains the highest risk within EMEA. On the positive side, rate hikes and other adjustments have helped to curtail the country’s most nagging imbalance – the current account deficit which shifted to a surplus in August as shown in Chart 3.
The shift to orthodox policy and external adjustment has been a strong tailwind for Turkish assets. However the deficit improvement has flowed largely from a collapse in domestic demand and political risk is far from removed. At the same time President Erdogan remains committed toward consolidating his power and pushing an unfriendly market agenda. We suspect volatility will remain elevated and continue to avoid Turkish assets.
Chart 3: Turkey’s current account balance
Source: Bloomberg, January 2019
We remain selective within South Africa as well and limit exposure to gold miners. Valuations have improved for the broader market but only to neutral on our models. Poland and Hungary rank little better on valuations or overall scores.
This leaves Russia as our favoured equity exposure in EMEA for its best in class valuations and particularly strong macro fundamentals such as a very healthy external position. Russia recently returned to twin surpluses with a 2.7% budget surplus and a 7% current account surplus. The risk from escalating sanctions remains a wild card but the worst seems to be over.
The outlook for LATAM appears relatively rosier. Within LATAM, political prospects are indeed diverging between Brazil and Mexico with Brazil seeking to reform while Mexico leans left. However markets seem to have overshot the relative sense of optimism and pessimism, respectively. As a result we are more constructive on Mexican assets, both equities and bonds. We also find good reason to remain constructive on both Chile and Colombia while staying more circumspect about Peru and Argentina.
While enough stars may have aligned to support an upgrade to the EM ex-Asia bloc as a whole, EM equities remain far from homogenous and investors should continue to seek quality exposure at a country, sector and security level. Please see our EM Quarterly report for a granular view on all major markets within EM, by asset class.
Global bonds
There was no change to our preferred sovereign bond exposures with Australia and Canada remaining at the top. The most notable shift in our hierarchy was the dropping of Italy down to an underweight position.
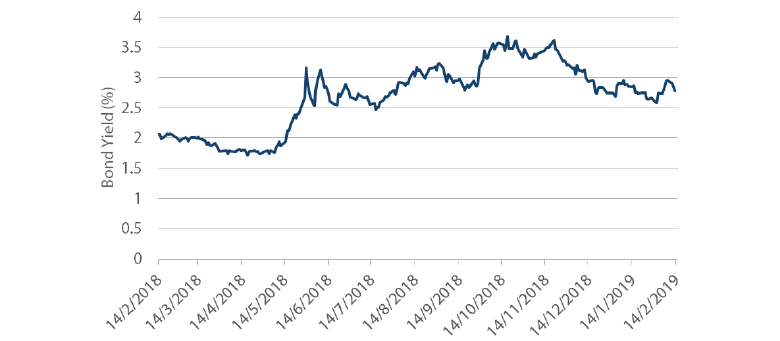
Italian government bonds have performed strongly since the height of the dispute between Italy and the EU over the former's budget plans. After safely navigating credit rating reviews by both S&P and Moody's last October by maintaining investment grade credit ratings, the recent agreement on Italy's budget for 2019 at 2.04% of GDP has returned some normalcy to Italian government bond trading.
Chart 4: Italy’s 10-year government bond yield
Source: Bloomberg, December 2018
In 2018, Italian bonds first came under pressure in May following the formation of a new government by populist coalition parties, Five Star and the League. Bond yields then settled into a higher trading range until sentiment was hit again over fears that Italy’s new budget for 2019 would not be acceptable to the European Commission (EC).
We first introduced our thoughts on Italian bonds in the October 2018 Balancing Act as yields were topping out almost 2% higher than their lowest point in April. At that time we recommended adding them to a sovereign bond allocation. Fast forward to today and although we have owned Italian debt through a period which has rewarded us, the time has come to start reducing exposure. While we believe we are adequately compensated for owning Italian debt at higher yield levels, once yields come back down as they have, Italian bonds are not nearly as attractive.
Italy continues to have a debt problem and any slowing in Europe and the Italian economy will put pressure on its deficit where there is very little buffer. This vulnerability leaves Italy open to bouts of panic in markets. As a result we don't see Italian bonds as a buy and hold candidate even though opportunities can arise when risk premiums seem excessive, as was the case in October.
Global credit
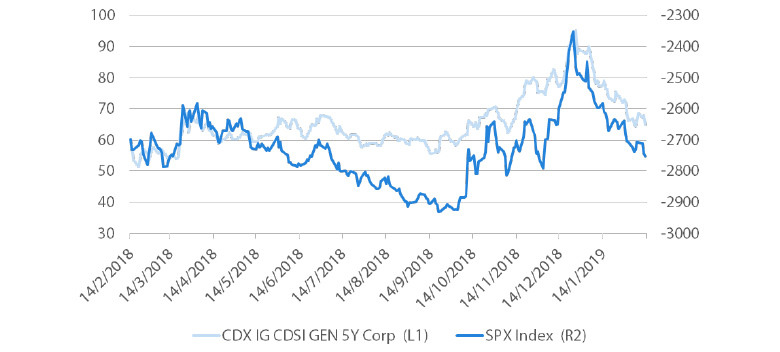
Credit spreads have staged an impressive recovery to begin 2019. Both investment grade (IG) and high yield (HY) spreads had widened almost in lock-step with falling US equities markets as volatility increased. This is not surprising given the well-known sensitivity of corporate credit spreads to equities prices. This relationship has also held on the flipside as credit spreads have contracted this year alongside recovering equities markets. While equities markets have certainly helped, we think there is also a broader positive story behind credit at work.
Chart 5: US IG spreads and S&P 500 index (inverted)
Source: Bloomberg, February 2019
As we referenced in our introduction, the Fed has seemingly gone out of its way to reinforce the recent easing in financial conditions through its emphatically dovish guidance on monetary policy. This short term relief on corporate borrowing costs has certainly been complementary to an already strong US business environment enjoying an economy that continues to grow above trend. So in the medium term, these tailwinds could combine with constructive equities markets to provide attractive returns ahead for credit markets.
FX
Given the Fed’s pivot to uber dovishness, we dropped USD two notches down the hierarchy just below JPY. In addition to a dovish Fed, a likely trade deal and slowing US growth at the margin are additional headwinds to the dollar. However, additional volatility can be expected before a trade deal is actually done.
We also raised CNY to the top of the hierarchy partly for a more dovish Fed but mainly for the prospects of a trade deal where the Chinese currency would be a principal beneficiary. Also, as the credit impulse has shown improvement, growth should find better support though it will take time for there to be a meaningful impact on the real economy. Lastly, portfolio flows to China and more broadly have picked up quite considerably with the return of risk appetite and prospects of a trade deal. Inclusion of mainland equities and bonds in benchmarks will also help to support inflows and therefore the currency.
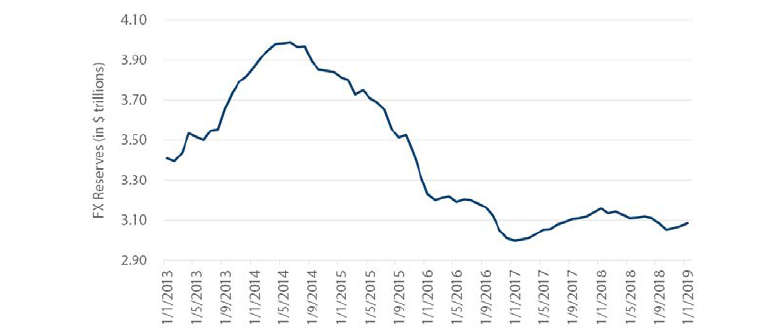
As shown in Chart 6, FX reserves have stabilised and grown modestly since September, regaining about half the reserves lost from March when trade war fears began to escalate. Part of the increase is the currency effect as CNY and EM FX also bottomed relative to the dollar back in September.
Chart 6: China’s FX reserves
Source: Bloomberg, January 2019
Clearly, the risk to our view is that a trade deal is not completed and tariffs are allowed to ratchet up. Again, this risk seems more remote, but would certainly be a fat tail to lift the dollar and drag down CNY along with the rest of EM FX.
Commodities
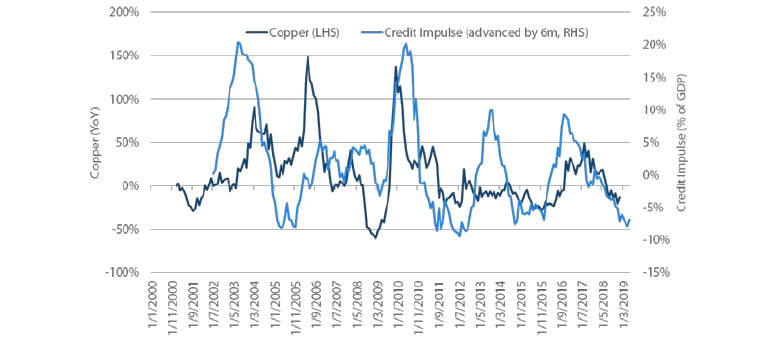
When it comes to industrial metals, the most quotient of demand prospects remains with China, having traditionally relied on credit-financed investment (property, infrastructure etc) to spur growth when needed for the last decade. However, this time is different given that China is more deeply committed to quality growth and continuing its deleveraging campaign to reduce systemic risks. In its most recent efforts to deleverage through containment of shadow banking, infrastructure investment tumbled from 20% to less than 5% in one year, and industrial metals fell victim to the weak demand. As shown in Chart 7, the China credit impulse fell quite considerably, dragging down with it copper and base metals more generally.
Chart 7: China credit impulse and copper price
Source: Bloomberg, Nikko AM, January 2019
Is the worst over? We think so. While the government is keen on reducing leverage, it also recognises the collateral damage due to broadly tight credit and is stepping up efforts to ensure credit flows to the parts of the (quality) economy that need it.
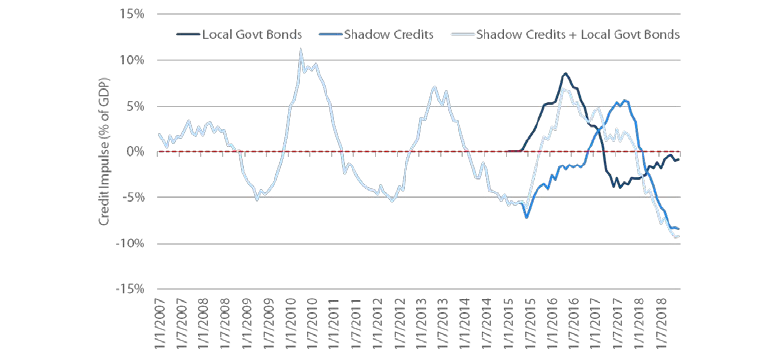
The credit impulse has improved at the margin, and is expected to continue to improve, in part due to bond issuance to finance infrastructure investment. During the annual Central Economic Work Conference (CEWC) in December, the government announced impending issuance of local government special bonds on “a large scale” to finance infrastructure investment.
Chart 8: China local government bond and shadow credit impulses
Source: Bloomberg, Nikko AM, January 2019
While these developments are encouraging, we think caution is still warranted. Unlike in 2015 when the government fully opened the credit spigot to generate growth at any cost, China’s continued commitment to contain systemic risks and the lack of panic about current growth conditions means efforts to boost infrastructure investment will be gradual and could even disappoint, should authorities find difficulty in reigniting the credit impulse.
Process
