Summary
The Australian economy performed well during 2018 with rising GDP, lower unemployment and stable inflation. Despite this, the outlook for 2019 is not as positive, as a number of factors are beginning to point to downside in the Reserve Bank of Australia (RBA) achieving their policy mandate. This includes:
- low inflation
- a declining housing market
- a potential slowdown in China, and
- volatility returning to risk markets.
1. Inflation: More than just a temporary drag
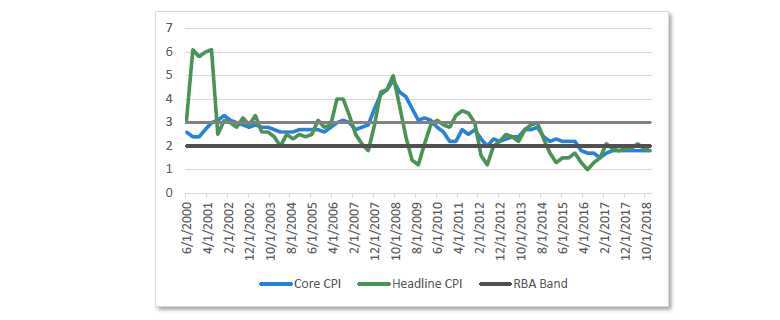
Over the past five years inflation has been persistently low globally, and this has been no different in Australia. Headline inflation dropped below the RBA’s 2 – 3% band in December 2014 and has spent the past four years bouncing between 1 – 2%. While the market had expected this to move back into the RBA’s band through 2019, the early signs suggest that this is not likely to occur due to both housing and oil.
Chart 1 Australian inflation
Source: Bloomberg
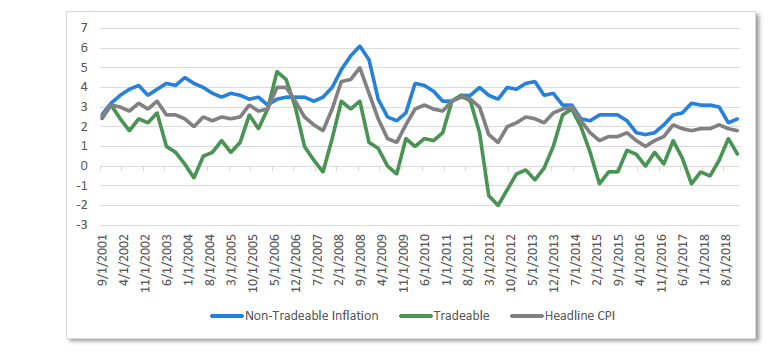
When breaking down inflation by component, the risk becomes more visible. Chart 2 shows inflation by non-tradeable inflation (items exposed to a low degree of international competition), and tradeable inflation (items exposed to offshore competition). This breakdown shows that the increase in inflation from the low point of 2016 was mostly due to non-tradeable inflation, reflecting increased inflationary pressures in the domestic economy. Tradeable inflation, however, has been non-existent, sitting below 2% in every period since the middle of 2014.
Chart 2 Australian inflation breakdown
Source: Bloomberg
Housing inflation
It would appear the housing market was having an inflationary effect on the domestic economy, which poses a problem for the RBA. Housing inflation makes up over 20% of the total Australian inflation basket and includes four broad categories: rents, new dwelling purchases, utilities and other (such as maintenance and property rates and charges).
The housing outlook for Australia continues to deteriorate and this means we can expect the positive housing impact of 2016/2017 to turn into a drag on housing inflation. For example, this drag is set to show up in rents as Sydney rental prices are declining and governments are actively talking about how to lower household utility costs —a large inflationary component in 2017.
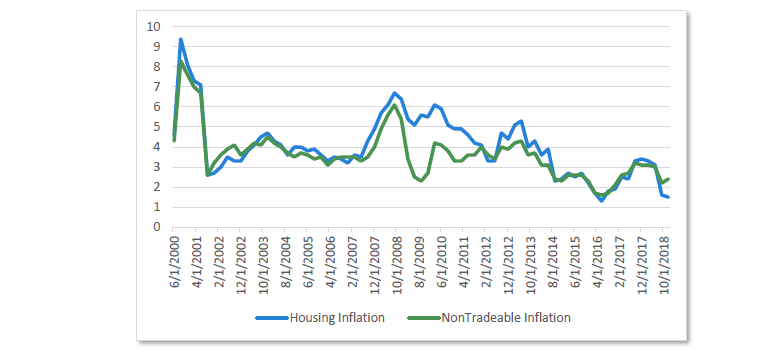
As can be seen in Chart 3, slowing inflationary pressures in the housing sector will most likely flow into weaker non-tradeable inflation, as this has had a very large effect on non-tradeables since the house price appreciation cycle begun in 2013.
Chart 3 Housing inflation and non-tradable inflation
Source: Bloomberg
Transport inflation
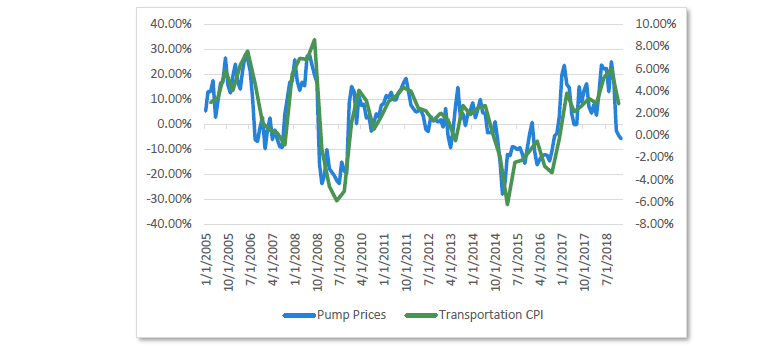
Another problem weighing against inflation comes through the transportation series, which has a strong correlation to oil. The cost of petrol plummeted in the fourth quarter of 2018, after steadily rising over the past two years. Transportation inflation makes up over 10% of the CPI basket and the declines in petrol prices mean this series will move from a highly inflationary effect (running at +6% pa), which was contributing to inflation, to a deflationary item, which will begin to detract from inflation.
Chart 4 Pump prices and transportation inflation
Source: Bloomberg
Given housing and transportation inflation look to be muted for 2019, over 30% of the total CPI basket will be generating very little inflation. This means the other 70% will need to generate high levels of inflation to get the RBA back to their 2 – 3% band.
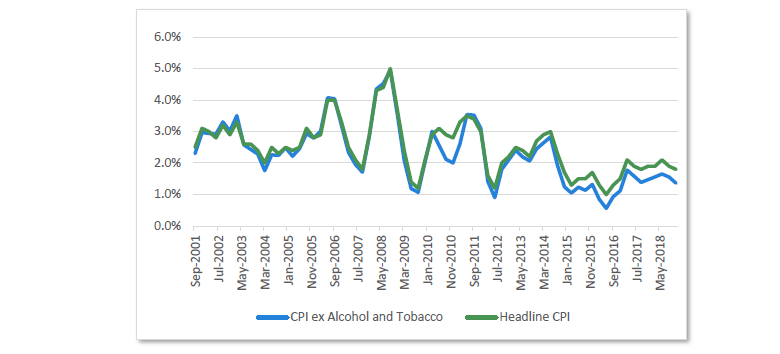
Over the past three years, tobacco and alcohol have been highly inflationary, but outside of this there have been few other pressures. This raises a question about where inflation will be generated from. An example of these muted inflationary pressures can be seen in the Inflation excluding alcohol and tobacco series, as tobacco prices increased 15% in 2018 due to tax increases. This saw tobacco contribute 0.50% to the headline inflation figure, despite only making up around 3% of the inflation basket. Without tobacco tax increases, Australian inflation is running closer to 1.3% year-on-year, a considerable increase to overall inflation given only around 15% of Australians over the age of 18 smoke.
Chart 5 Australian inflation excluding alcohol and tobacco
Source: Australian Bureau of Statistics, Bloomberg
Unless oil rallies or the housing sector improves, it seems likely that inflation will print below the RBA’s 2 – 3% band for another year. The market narrative: ”As long as the housing declines don’t reach the real economy there is no reason to reduce rates” could be tested this year.
2. Australian housing: Still showing signs of slowing
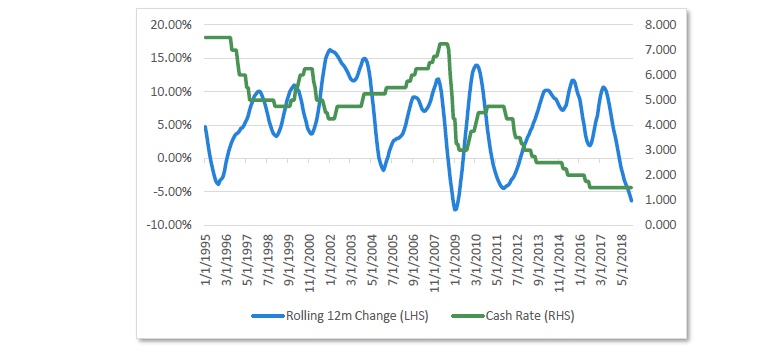
The second factor pointing towards a more accommodative RBA is the continued decline in Australian housing, which fell more than 5% in 2018. The declines of 2018 were the worst in 20 years for Australian households and were mostly concentrated in Sydney (-9%) and Melbourne (-7%), both of which saw very strong appreciation from 2012 to 2017. From an historic perspective, when Australian house prices are declining the RBA typically moves to make financial conditions easier, not hike rates.
Chart 6 Australian house prices and RBA cash rate
Source: Bloomberg
Currently, the forward indicators for house prices are pointing to continued declines through 2019. This can be seen in Charts 7 and 8, which show weak auction clearance rates and mortgage finance approvals, both of which are yet to show any sign of stabilising.
Chart 7 Auction clearance rates, Chart 8 Mortgage approvals
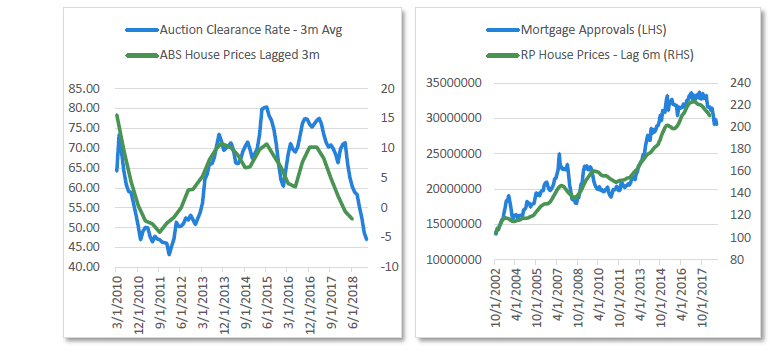
Chart 7 Source: Bloomberg, Chart 8 Source: Bloomberg
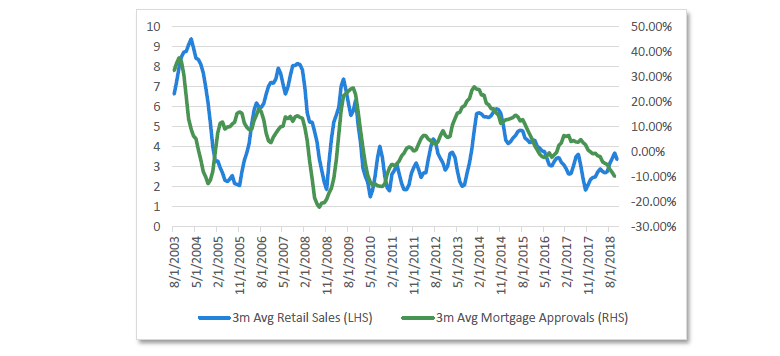
The risk for the RBA is that the declines in the housing market have a larger effect on the real economy than observed in 2018. We see three key risks areas where this could unfold. Firstly is through the consumer. Last year, consumption grew at ~2.5% despite weak wages growth and falling house prices. Historically, mortgage approvals lead the direction of retail sales, as borrowing pulls forward consumption that is often associated with household purchases.
The lone period of strength in retail sales over the past 10 years occurred during the first round of interest rate cuts in 2013, around the same time as the house price appreciation cycle began. Since then, there has been a slow grind lower as mortgage growth eased.
While retail is holding up well in the face of the recent mortgage approval declines, it is hard to imagine consumption running away when wages growth is below 3% and the banks are not yet loosening lending conditions. The risk here is that further declines in house prices cause consumers to become overly concerned with their current situation.
Chart 9 Mortgage approvals and retail sales
Source: Bloomberg
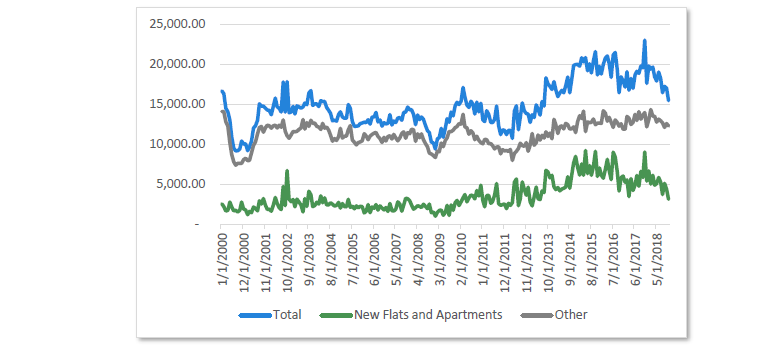
The second risk is in the construction sector, as strong house price appreciation has seen a historically large amount of construction over the past five years. Building approvals increased from their long-run average levels in 2011 to multi-decade highs through 2014 to 2017. A large percentage of the increase was in apartments, which are set to come online over the next few years.
Given house prices are declining, lending conditions are tight and the AIG Construction survey shows apartment activity at contractionary levels (26 versus a neutral level of 50), building approvals will likely be softer in 2019 compared to the past five years. While the economic effect is unlikely to be felt until the second half of 2019, as it takes some time to go from approval to completion, it will be a concerning sign for the RBA as according to Bank for International Settlement1 , “Drops in residential investment consistently lead… economic downturns”.
1 BIS Workshop Papers No 726, Residential investment and economic activity: evidence from the past five decades by Emanuel Kohlscheen, Aaron Mehrotra and Dubravko Mihaljek, Monetary and Economic Department, June 2018.
Chart 10 Building approvals
Source: Bloomberg
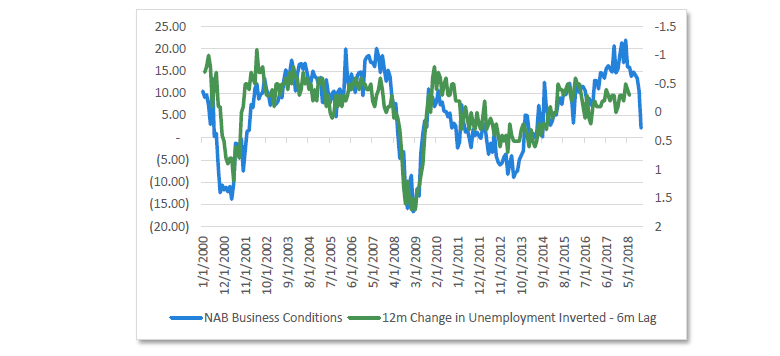
The third risk is that the weaker housing outlook eventually flows into the business sector. While the consumer has been relatively weak over the past three years, this has been offset by an optimistic business sector as the NAB Business Conditions survey rose to a 10-year high in 2017-2018. Business conditions have since begun to slow and implies that we should see the unemployment rate begin to stabilise after falling from 5.8% in 2016 to 5.0% in 2018. If the business sector begins to believe that housing is having an effect on the economy, through either construction or retail spending, then confidence could decline, which will cloud the employment outlook.
Chart 11 NAB business conditions and unemployment
Source: Bloomberg
3. China: Cutting rates to combat a slowdown
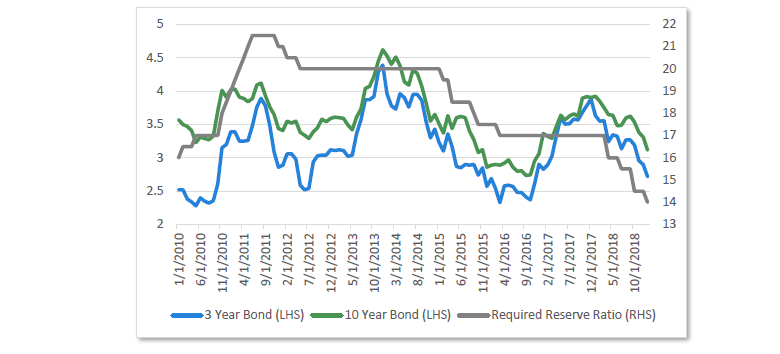
The wildcard for the Australian economy through 2019 will be China, which has seen deteriorating conditions over the past 12 months. A number of economic statistics, such as retail sales, industrial production and fixed asset investment slowed to decade-low growth rates, prompting the Chinese government to ease monetary policy. While interest rates in the US were selling-off in 2018, Chinese rates rallied almost 100 points, which was similar in magnitude to 2015 when commodity prices slowed and global deflation became a widespread fear.
Chart 12 China bond yields
Source: Bloomberg
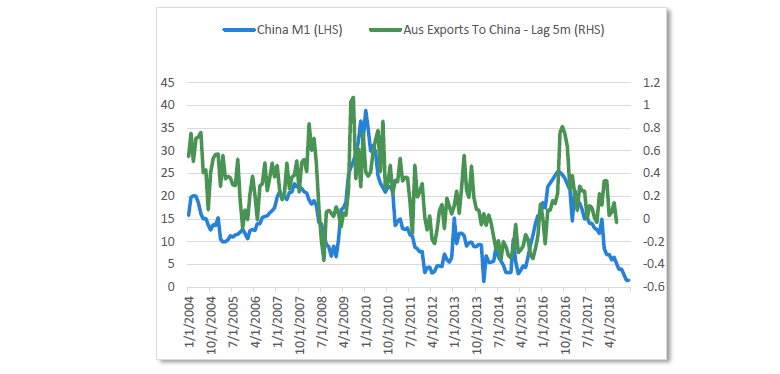
A lead indicator of the Chinese economy over the past five years has been Money (M1) growth, which accelerated rapidly through 2015/2016 before peaking and falling to their current 20-year lows. The decline in M1 growth reflects the fact that China is actively trying to delever their economy and reduce debt levels. While this is positive for the long-term outlook of China, the short-term decline in M1 growth signals a further slowdown in trade for the Chinese economy through 2019.
Chart 13 China money growth and Australian exports
Source: Bloomberg
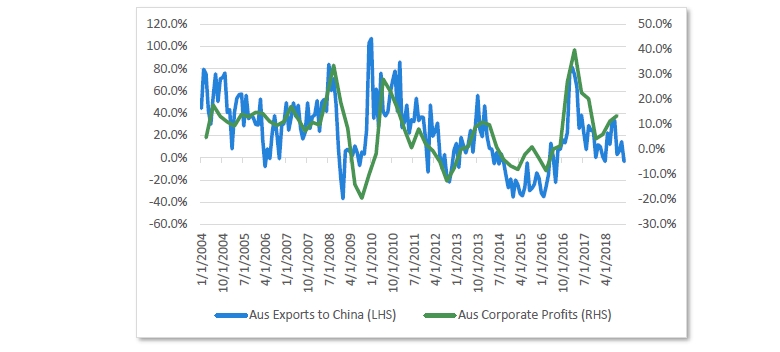
The risk to Australia is that corporate profits have become highly correlated with the growth in exports to China. This means if the Chinese economy continues to slow, then Australian exports will also weaken and put pressure on corporate profits. Part of the decline in business conditions since the peak of late 2017 may reflect weaker expectations about China.
Chart 14 Australian corporate profits and exports to China
Source: Bloomberg
Overall, this makes China the wildcard for the RBA. Given house prices are falling and inflation is low, any further slow-down in China will hurt our economy and create a corporate environment similar to 2015/2016. While economist believe that the RBA will be able to keep rates stable, we see more risks to the downside, which will make it more likely than not that they cut interest rates.
4. Is history repeating?
A final point to make on the risk of an interest rate cut is to compare the current economic data with the start of the past three interest rate easing periods (2011, 2015 and 2016). To do this we focus on the economic indicators of GDP, inflation, wages, unemployment, business conditions, retails sales, credit growth, house prices and stock prices. This will help frame where we are in the cycle and how todays’ figures compare to previous easing since the GFC.
Table 1 Economic indicators

Uses data from month or quarter before RBA decision
Source: Bloomberg
From this perspective, today’s data is slightly ahead of what was seen when each of the past three policy easing episodes started. For example, Real GDP growth of 2.8% is ahead of the 2.5% average, inflation of 1.8% is ahead of the 1.3 1.7% levels of 2015 and 2016, and unemployment of 5.0% is below the 5 – 6% range of prior cuts. However, this is not the case for all indicators. Retail sales are now below prior levels, house prices are showing larger declines, and credit growth is below the 6% levels of 2015 to 2016.
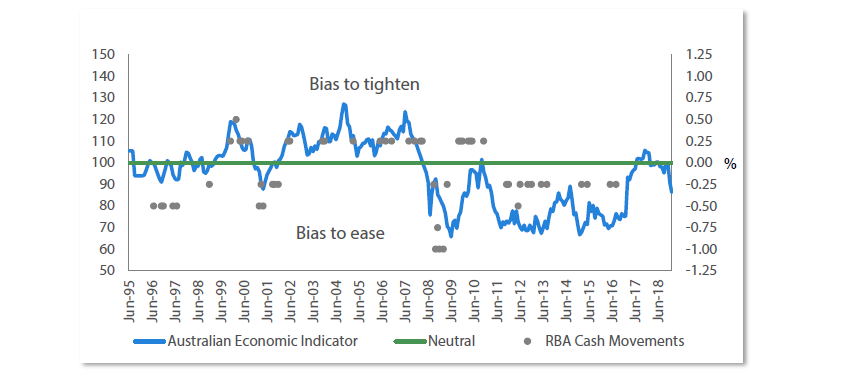
While the data is marginally better than prior easing episodes, any deterioration through 2019 has the potential to pull it in line with conditions seen in 2015 and 2016. This is reflected in our Monetary Bias indicator, which measures the strength of economic conditions. While the indicator was strong through 2017, it has since seen a rapid deterioration and is now only marginally above the levels which were consistent with interest rate cuts in 2012, 2015 and 2016.
Chart 15 Australian monetary bias indicator
Source: Nikko Asset Management, Bloomberg
Making the cut
One of the key arguments against further interest rate cuts that we consistently hear is that cutting rates would have little effect as rates are already too low. While we can acknowledge that interest rates look low from an historic perspective, as far as we are aware no central bank has acknowledged that monetary policy is ineffective. In fact in a recent speech from Deputy Governor Guy Debelle on the Global Financial Crisis he stated that there is “Still scope for further reductions in the policy rate” and that it is “the level of interest rates that matters and they can still move lower.” On this basis, we are led to believe that the RBA still see monetary policy as an effective tool and if required to meet their 2 – 3% inflation target they will make the necessary policy adjustments.
Outlook for rates
Cash rates
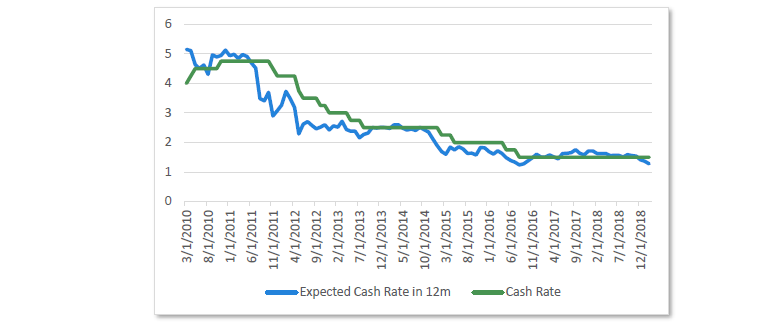
On the back of this outlook we believe there is a greater than 50% chance that the RBA will be required to cut interest rates this year. This is close to market expectations, which currently forecast cash to be 1.27% in 12 months’ time. While the market often describes rates as low, we think they fairly represent the cash rate environment that we are in, and believe if the RBA is required to ease conditions it will cut interest rates twice, moving to 1%.
Chart 16 Market cash rate expectations
Source: Bloomberg
3-year bonds
If the interest rate were cut to 1%, current 3-year bond yields would be relatively high compared to history, based on the fact that 3-year bonds typically trade between -50 to +50 points over the expected cash rate in 12 months’ time. As Charts 17 and 18 show, a move to a cash rate of 1% would see the current yield of 3-year bonds sitting 60 basis points above cash, a stretched level versus history.
To normalise this spread, 3-year bonds would need to fall 30 - 60 basis points, as historically 3-year bonds trade to the expected cash rate after a cut. In the event of the RBA remaining on hold, then cash rate expectations should rise back to 1.50%. This should see 3-year bonds yields sell off around 30 - 50 basis points, back towards 2%. For short-dated bonds we see rates biased downwards this year, with a risk of a mild sell-off occurring if the economic data improves.
Chart 17 3-year bonds vs expected cash rate, Chart 18 3-year bonds – expected cash rate
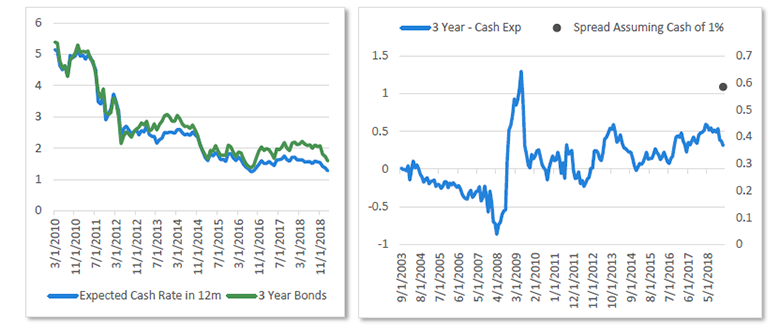
Chart 17 Source: Bloomberg, Chart 18 Source: Nikko Asset Management, Bloomberg
10-year bonds
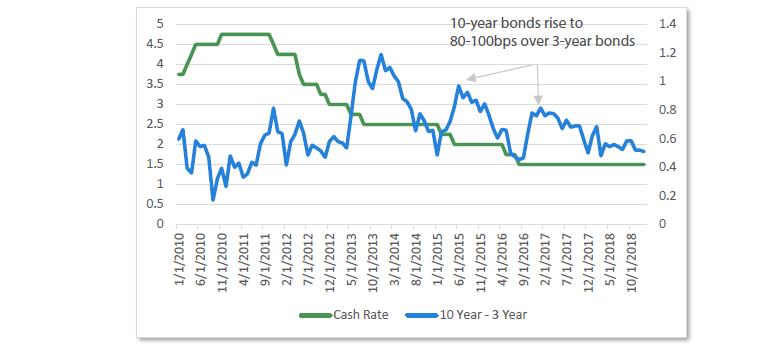
For longer-dated bonds, a cash rate vs bond spread is not quite as stable and hence we look at the spread between 10-year and 3-year bonds to determine the direction. Typically when the RBA cuts interest rates the spread between 10-year and 3-year bonds rises (I.e. 3-year bonds fall further than 10-year bonds). In the cuts of 2015 and 2016, this rose ~80 to 100 basis points. Given we expect 3-year bonds to fall 30 - 60 basis points in the event of a cut, this would imply that 10-year bonds would fall around 20 basis points. In the event of the RBA remaining on hold, we believe the current 50 basis point difference between 3- and 10-year bonds holds, leading to 10-year bonds selling off by 30 - 50 basis points, similar to 3-year bonds.
Chart 19 10-year and 3-year bonds
Source: Bloomberg
Offshore spreads: United States vs Australia
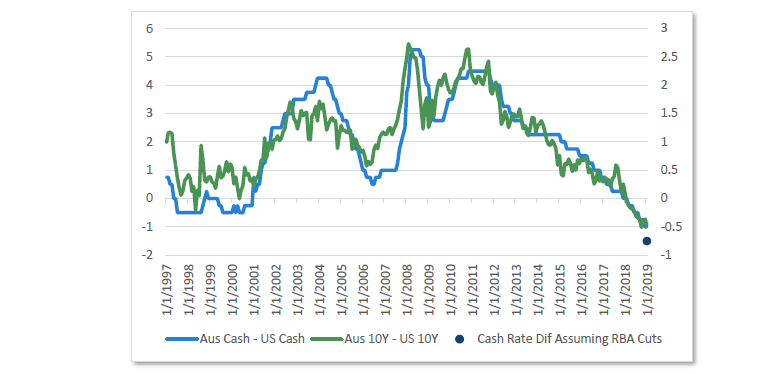
The final interest rate spread worth pointing out is the Australian/US spread, which contracted to historical lows of -50 points in 2018. Through 2018, many expected Australian interest rates to sell off, as they were too low compared to US bonds. However, this overlooked the fact that the cash rate differential also contracted to historical lows, as the US cash rate rose to 100 points over Australia’s.
Given our expectations that the RBA lowers rates this year, this will pull the cash rate differential into further negative levels if we assume the Federal Reserve is on hold. What this means is that while Australian rates are already at historic lows versus the US, it could contract towards -75 basis points if the RBA were to ease monetary policy. In our view, stating that rates should move higher simply because US rates are higher overlooks the shift that has occurred in cash rate differentials.
Chart 20 Australian and US interest rate differentials
Source: Nikko Asset Management, Bloomberg
Conclusion
The economic situation in Australia has deteriorated over the past six months, after showing strong performance through 2017 and the first half of 2018. This is being reflected in declining house prices, slowing business conditions, low inflation and the risk that China’s economic performance deteriorates. While there is not yet a smoking gun for the RBA to move interest rates, the lack of inflationary pressures coupled with declining house prices means we believe it’s more likely than not that the RBA will eventually cut interest rates to improve the economic outlook.
If the RBA were to cut the cash rate, 3-year bonds would be approximately 40 – 80 points above their historical relationship to cash and imply bond yields rallying in 2019. In the event of the economic data improving and the RBA remaining on hold, bond yields have the ability to see a marginal selloff towards the average levels of 2018. In our opinion, it seems doubtful that the Australian economy could handle a meaningfully higher interest rate structure given the current conditions, making the continued fears of a 1994-style sell-off seem somewhat overblown.


