Snapshot
After a dismal finish to 2018 for growth assets, the jury was always going to be out on how investors would approach the next 12 months. With the first few months now behind us, the verdict would appear to be cautiously optimistic as global equities have bounced back strongly. Led by double-digit percentage gains in US and Chinese equities, even the much maligned European equities have joined in the rally. Confirmation of this improvement in investor sentiment can also be seen in the high yield and investment grade credit markets, both of which have achieved strong performance this year.
A wall of worry in the last quarter of 2018 seemed to have blocked investors from seeing any light at the end of the tunnel. We would draw out two important factors among many that contributed to this pessimism. The first was the trade war that US President Trump and his advisors had been waging with China. The imposition of a wide range of tariffs on US imports and threats of more to follow had started to show up in the trade numbers and the uncertainty was negatively affecting new capital investment decisions around the world.
The second factor was the tightening of global financial conditions and liquidity as the US Federal Reserve (Fed) raised its Fed Funds Rate four times and continued the slow contraction of its balance sheet. The FOMC also confirmed its path of interest rate normalisation would continue at its December meeting. As the selloff in global equities gathered momentum in the fourth quarter, the Fed’s overall message that the US economy continued to perform strongly was overlooked by many investors. At the same time, this tighter policy stance was also contributing to US dollar strength, putting pressure on emerging markets.
The recovery in risk assets has been supported by better news on both issues to start the year. While we certainly wouldn’t call either of them resolved, the Fed has clearly taken the market’s message to heart, backing off its rates normalisation message and reviewing the balance sheet reduction with an eye to ending it later this year. Also, recent messaging from both the US and China has been pointing to a possible trade deal on the horizon following recent negotiations and a delay to higher tariff rates, which were due to increase at the beginning of March.
These two “good news” items have undoubtedly helped lighten the mood and loosen the grip of pessimism that has been the prevailing sentiment. Although the improvement in risk assets so far would suggest that optimism has returned, we are not so sure. Less pessimistic is perhaps how we would describe the current climate, noting that overall sentiment is still fragile. When pessimism is seemingly validated by falling asset prices as it was in the fourth quarter, it often takes longer to turn negative outlooks into truly positive ones, irrespective of better news flow.
Perhaps it’s just human nature that our hurt stays with us longer and the change from pessimism to optimism takes longer to unfold. However, from an investment perspective, this creates opportunities as price changes can be slow to catch up with an improving outlook. Although it is most often correct to be cautious of rampant optimism, guarded optimism or weakening pessimism can create favourable investment opportunities.
Asset Class Hierarchy (Team view1)
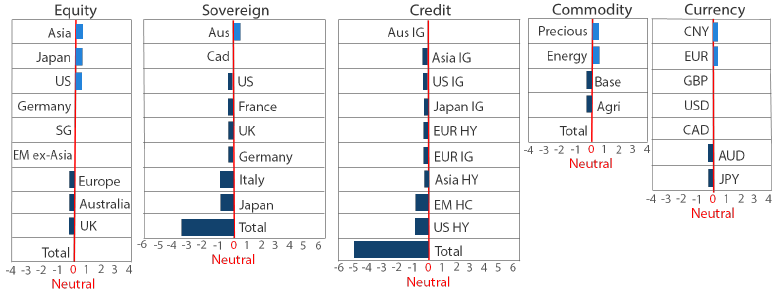
Note: Sum of the above positions does not equate to 0 in aggregate – cash is the balancing item.
1The asset classes or sectors mentioned herein are a reflection of the portfolio manager’s current view of the investment strategies taken on behalf of the portfolio managed. These comments should not be constituted as an investment research or recommendation advice. Any prediction, projection or forecast on sectors, the economy and/or the market trends is not necessarily indicative of their future state or likely performances.
Research Views
We make adjustments to our asset class views and hierarchies as discussed below.
Global equities
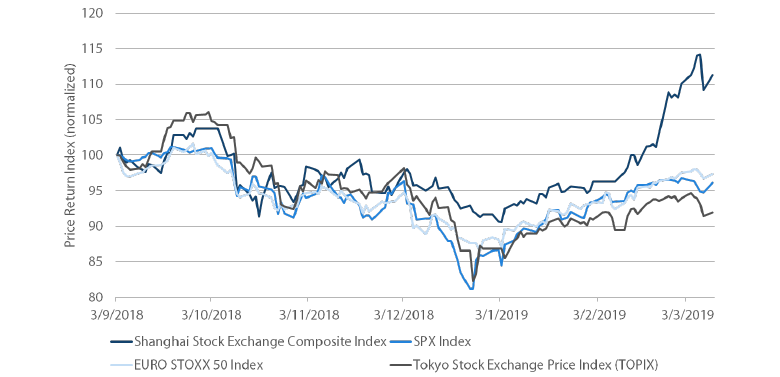
We retain our constructive outlook on equities as a whole, as well as our relative preference for Asia. Chinese domestic equities rallied +20% over the last month in anticipation of a trade deal with the US and in response to the fiscal and monetary easing measures announced by the government to manage the ongoing growth slowdown.
Chart 1: Chinese equities outperformance
Source: Bloomberg, March 2019
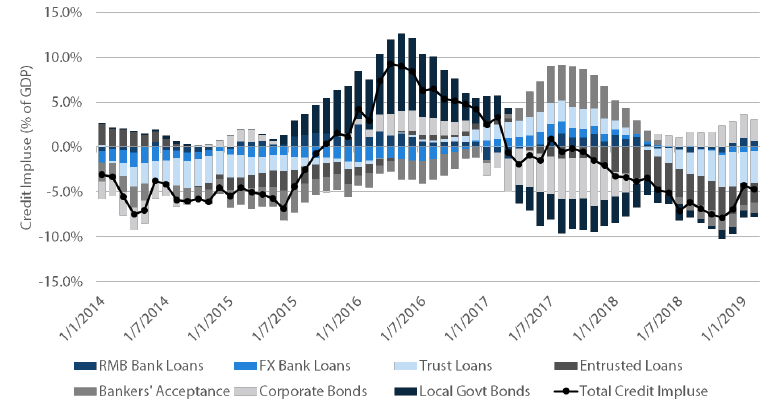
We believe this outperformance could continue as investors get more confirmation of a bottoming out in the recent growth deceleration. In this regard, the pickup in credit impulse over the last two months is particularly noteworthy. As shown in Chart 2, the credit impulse had been weakening since mid-2016 due to the government crackdown on excessive credit creation. However, it rebounded in January due to an increase in corporate bond issuance and bank lending. While further reductions in the required reserve ratio and possible interest rate cuts would make monetary conditions easier still, the main benefit is likely to accrue from a continued thrust to credit impulse through the bank lending channel.
Chart 2: Pick up in China credit impulse
Source: Bloomberg, Nikko AM, March 2019
News headlines on China’s economic growth will likely remain bleak for a few months. This is because it usually takes time for monetary easing to be fully transmitted to the real economy. The rebound in credit growth too will take time to broaden out from the government directed increase we are seeing currently to a more widespread increase in real credit demand.
Past experience from the 2015 monetary easing cycle suggests a pickup in economic activity indicators two to three quarters from the start of easing. As such, we would expect a pickup in both statistics and news sentiment only in the second half of the year.
Meanwhile, investors are presented with a compelling valuation opportunity to build their China exposure. Even after the recent run up in prices, Chinese equities are over 10% lower than where they started out last year. US equities, in contrast, have more than recovered their year-end swoon and are 5% higher than where they started 2018.
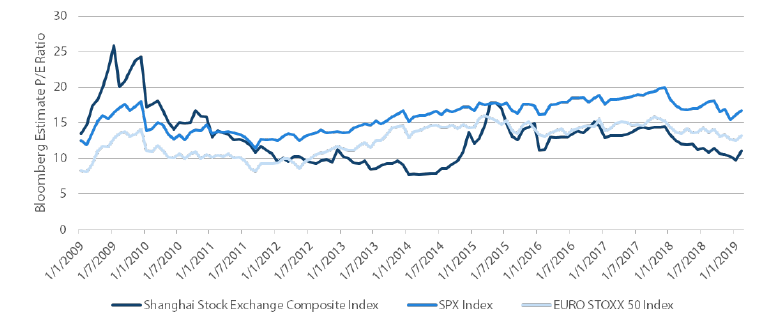
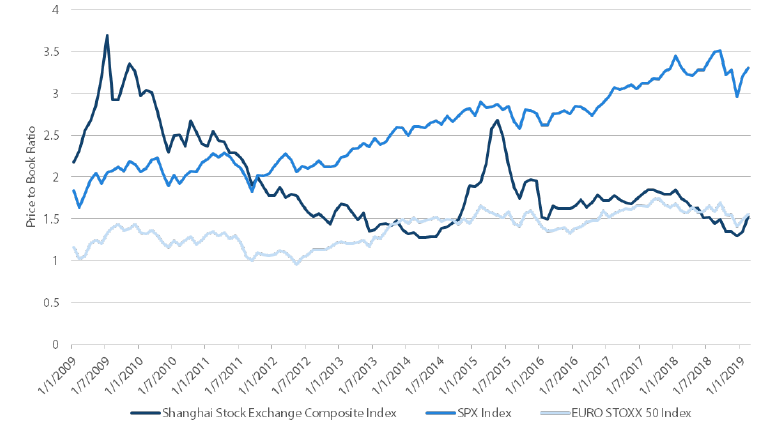
Chart 3 puts relative valuations for major markets in a slightly longer-term context. At 1.5 times Price to Book and 11 times 12- Month Forward Price to Earnings, Chinese equities are significantly cheaper than US equities, which trade at over 3 times their book value and 16.5 times forward earnings for example.
Chart 3: Chinese equities have valuation support
Source: Bloomberg, Nikko AM, March 2019
Outside of China, the big news has been the downgrade to growth and inflation estimates for Europe by the European Central Bank (ECB). The ECB President Mario Draghi surprised investors yet again with his dovishness by unveiling new support measures that include cheap loans for banks through the launch of another round of Targeted Long Term Refinancing Operations (TLTRO) and the use of forward guidance to reassure investors of the ECB commitment to keeping rates lower for longer. Markets have so far focused instead on the negative new sentiment of the cut to 2019 GDP estimates from 1.7% to 1.1% and the lower inflation forecasts. We believe this too presents an opportunity for investors to build exposure selectively to European equities as they too enjoy much of the same valuation support as China. The political outlook remains uncertain in the UK and European periphery so we remain selective with a preference for Germany given recent increases in fiscal spending and prospects of a China-driven export recovery.
Global bonds
While there was no change to our sovereign bond hierarchy, Australian government bonds have continued to earn their place at the top. Australia has been the best performing bond market in our developed market universe so far in 2019.
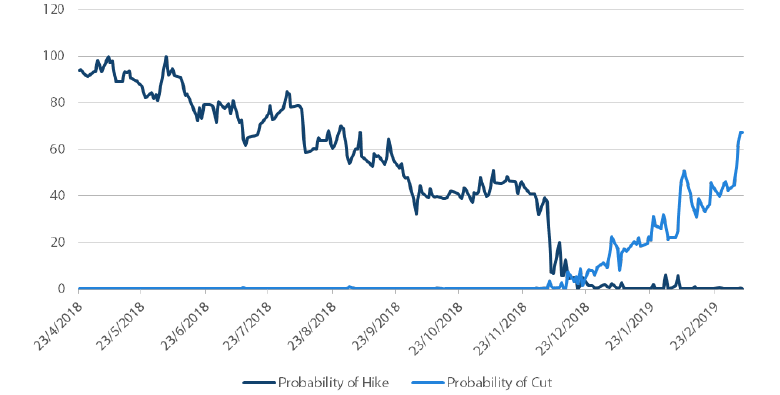
There has been a significant change in expectations for monetary policy from the Reserve Bank of Australia (RBA) over the last 3-4 months. Back in November 2018, market pricing was projecting the probability of a rate hike in Australia at over 40% and the probability of a rate cut as no chance at all. The rate hike odds begun to fall sharply during the global equities market selloff in December and now sit close to zero. Conversely, the odds of future rate cuts have steadily risen from 0% to a greater than 60% probability.
Chart 4: Implied Probabilities of Australian Rate Changes
Source: Bloomberg, March 2019
This turn around in market expectations has been largely driven by three main factors. The first factor has been weak business conditions and confidence. The NAB business indicators on current conditions and confidence have been at the weakest levels in 3 years. Concerns on global trade and sharp falls in global equities, and energy prices have certainly contributed to this general malaise.
The second factor has been the ongoing slowdown in Australian housing. Prices for established homes in Australia have fallen 1.9% in the year to 30 September 2018. Although this is perhaps not surprising, given the macro-prudential measures that were introduced by regulatory authorities in early 2017 to curb speculation and slow house price gains, it is still a drag on consumers’ balance sheets after previous double digit gains in house prices.
The third factor has been market analysts changing perceptions of recent RBA communications. While the RBA cash rate has been on hold for over two years, analysts had perceived a tighter policy bias in RBA statements and speeches by Governor Lowe up until more recently. Even though the RBA itself continues to deliver a balanced assessment of the Australian economy, the market’s perception has shifted towards a decidedly dovish assessment of the RBA’s intentions for future monetary policy.
Global credit
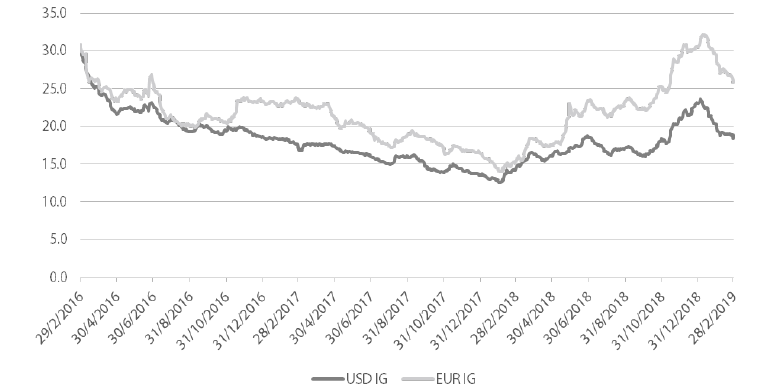
The two largest investment grade credit markets, the US and Europe, have had varying fortunes over the last three years. Using a measure of credit spread per unit of duration, we can adjust for differing average durations in the two markets and create a fairer comparison.
Chart 5: Option adjusted spreads (OAS) over effective duration
Source: ICE BofAML, March 2019
Although these two investment grade (IG) credit markets track each other in the general direction of spreads, greater volatility has been evident in the EUR market. Even though the ECB’s asset purchase program was active throughout much of this period, this central bank support has not lead to better credit spread performance relative to the USD IG market. Ultimately, the stronger economic performance of the US over the last three years has been the main determining factor in credit spread performance. As the European economy struggles to regain its composure, the wider credit spread for EUR IG is expected to continue to reflect a necessary risk premium to attract investors to EUR IG over US IG.
FX
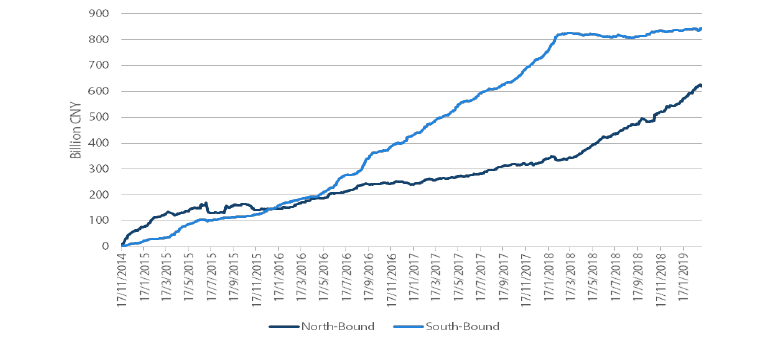
As China is firmly pursuing monetary easing, it has been surprising to see Renminbi strengthening against the US dollar (USD) since October, at a time when the USD index was still strong. A dovish Fed and a prospective US-China trade deal are bullish for the currency, in no small part due to foreign flows as China reforms and opens up its capital markets. It is well understood that Chinese assets are under-owned by global investors, and quickened inclusion into major indices are increasingly driving the cross border capital flows. Taking the Hong Kong – Shanghai Connect for example, foreigners have been piling into A-Shares since summer 2018, while onshore money managers have basically put a brake on flows to the southern border, see chart 6.
With still attractive valuations, the strong performances of Chinese assets year to date reinforce the flows and should keep Renminbi supported.
Chart 6: Hong Kong – Shanghai Connect Flows
Source: Bloomberg, Nikko AM, March 2019
Commodities
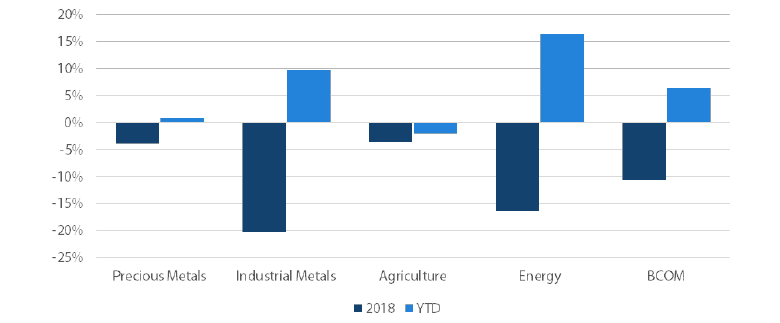
Commodities are continuing to recover from deep losses suffered last year as headwinds in 2018 are turning into tailwinds with a dovish Fed, China’s credit stimulus and constructive US-China trade talks. Better growth prospects should translate to stronger demand for commodities, especially for energy and industrial metals, see chart 7 below.
Chart 7: Commodities Spot Performance
Source: Bloomberg, Nikko AM, March 2019
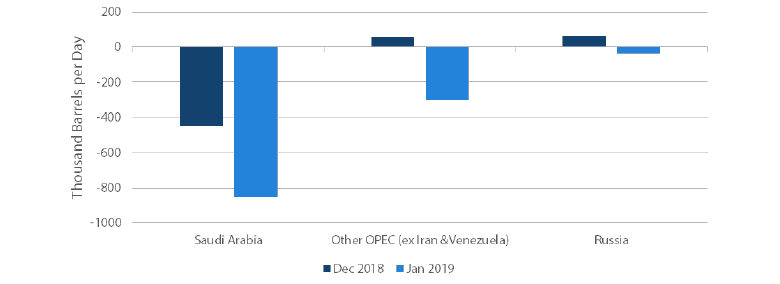
However, not all commodities are created equal. The best performer this year has been energy, but it is once again being engulfed by geopolitics. Right after concluding his latest trade talks with China, President Trump wasted no time in attacking OPEC on twitter. In response, Saudi Arabia Oil Minister defied the pressure and pledged more production cuts in the coming months. The political pressure should continue to mount on Saudi Arabia, which has implemented the bulk of its cuts agreed in the December accord. In addition, the Trump administration still holds a substantial supply card in the potential extension of Iran production waivers. As a result, we are seeing less upside in energy prices from here.
In contrast, we don’t see such resistance to strength in industrial metals. For this reason we have downgraded energy from top of commodity hierarchy and moved up industrial metals ahead of agriculturals.
Chart 8: OPEC+ Cumulative Production Cuts
Source: Bloomberg, Nikko AM, March 2019
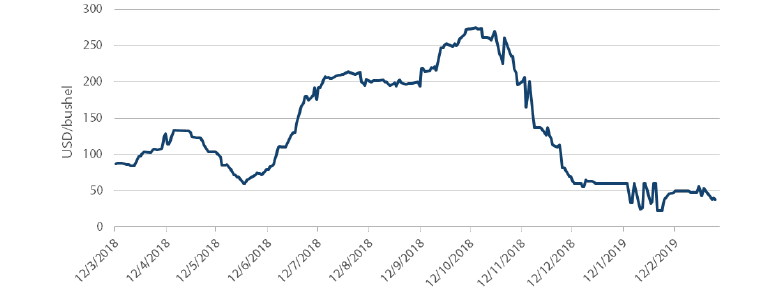
In agriculturals, China is going to resume imports of US soybeans as part of the trade deal, which should boost agriculture prices naturally. However, the agriculture index failed to perform. We think one possible explanation is that China is simply reshuffling its imports from another country and aggregate demand remains the same. As a result, the boost to soybean prices is rather limited when Brazilian soybeans are priced very competitively now.
Chart 9: Brazilian Soybean Basis
Source: Bloomberg, March 2019
Process
Contact Us
Phone:+65 6500 5700
Fax: +65 6534 5183
Email: SGContactUs@nikkoam.com


