Snapshot
Global equities soared by 12% in 1Q 2019 to post their best quarterly performance in almost a decade. Global sovereign bonds (hedged to USD) joined the party with a 3% gain that was even better than their performance in the “flight to safety” of the previous quarter. By comparison, gold disappointed by adding only 0.7% to the 7.5% gains of 4Q 2018. The commodities complex appeared to be front-running the upcoming growth turnaround with a 15% gain, led by a 25% increase in Brent crude oil. In fact, the last quarter was a great time to be invested in almost any asset, whether growth or income, risky or risk-free. The conviction we shared with readers in our first missive of the year on this being a great year for multi-asset investing stands well vindicated.
The performance of many of the funds we manage suggests multi-asset investors may have enjoyed their best quarterly performance in at least 10 years. This in itself is no mean feat, given global equities have risen an annualised 12% per annum (p.a.) over this period (+15% for US equities) and global sovereign bonds have gained 3.5% p.a. So an exceptional quarter in all respects.
In hindsight it is easy to attribute all the green on the screens to the excessive pessimism at the end of last year which had pushed valuations for risky assets to their most attractive levels seen in the recent past. Inexpensive starting valuations combined with a multitude of positive catalysts such as a whole new US Federal Reserve (a very dovish one), China’s credit stimulus and constructive US-China trade talks made for a very heady cocktail for asset class performance.
However, positioning data in the aggregate suggests that the performance of risk assets has outpaced the return of investor optimism. As we noted last month, the current climate is perhaps marked only by less pessimism rather than an outright pivot to optimism. Sentiment remains fragile. Negative outlooks of last year are still only gradually becoming more positive and the winds of change are only now starting to blow. Many investors who threw in the towel during the falling markets of 2018 have not participated in the recovery this year. This creates an investment opportunity by sowing the seeds for markets to trend higher as they get drawn in at higher levels. It also gives us yet more reason to stay true to our core investment belief of staying invested.
Staying invested is not easy when markets are drawing down because of the immense pressure from clients, risk management teams and management to act to stem losses. “Do something, do anything” is the often-heard refrain. The decision to not cut risk during such times is one of the hardest decisions that a portfolio manager can make, if only because the action of not doing anything is not accepted as a valid decision in itself. However, if there is one lesson we can take from the unloved market recovery of the last quarter then it is this: staying invested is the best antidote to investor regret.
We would do well to recognise that there is a flipside to this rosy story. For most investors the journey is just as important as the final destination. Conviction in delivering to a long-term return target is not much use if shorter-term drawdowns either exceed investor risk tolerance or render them unable to meet their ongoing liabilities. There are two ways to risk-manage such situations: ensuring that there is an effective downside risk management discipline in place at all times and placing great care in setting the right expectations with investors. We will have more thoughts to share on both in future editions of this newsletter.
Asset Class Hierarchy (Team view1)
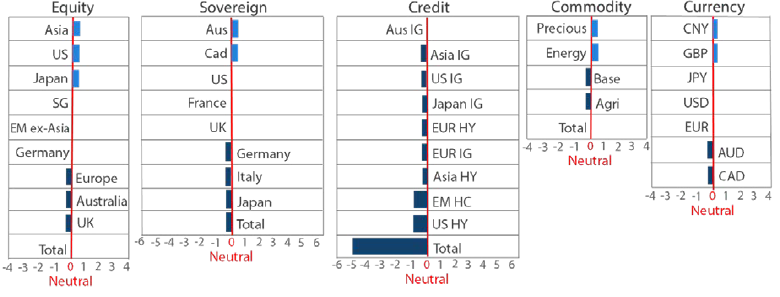
Note: Sum of the above positions does not equate to 0 in aggregate – cash is the balancing item.
1The asset classes or sectors mentioned herein are a reflection of the portfolio manager’s current view of the investment strategies taken on behalf of the portfolio managed. These comments should not be constituted as an investment research or recommendation advice. Any prediction, projection or forecast on sectors, the economy and/or the market trends is not necessarily indicative of their future state or likely performances.
Research Views
We make adjustments to our asset class views and hierarchies as discussed below.
Global equities
We remain constructive on equities globally, retain Asian equities at the top of the hierarchy and lift Emerging markets ex Asia to above Germany. As mentioned in the introduction, our constructive outlook on risky assets remains far from consensus.
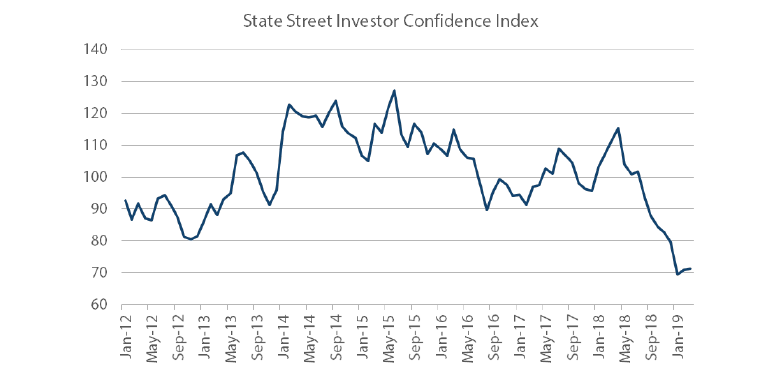
In Chart 1 we reproduce the State Street Investor Confidence Index. The index is computed by State Street to serve as an objective, quantitative barometer of global risk tolerance of the world’s sophisticated investors. It evaluates risk appetite by measuring actual investor holdings and recent purchases of riskier investments as opposed to safer investments that are held in custody by the company on behalf of their institutional investor client base. Its timeliness and objectivity make it a better measure of risk appetite than both the commonly used survey based measures of risk appetite and those that are based on observation of market prices.
As shown in Chart 1, according to this measure, investor risk appetite started falling in early 2018 and has yet to recover meaningfully.
Chart 1: Positioning data suggests little participation in 2019 risk rally
Source: State Street, April 2019
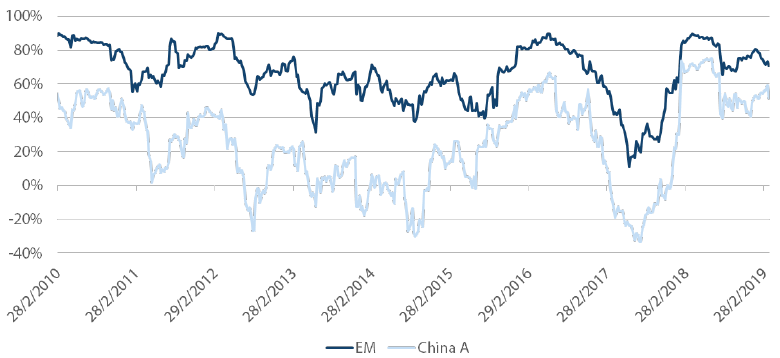
Our increasingly bullish view on emerging markets (EM), particularly China, is also supportive of a constructive view on German equities given the economic linkages between Germany’s export sector and the Chinese domestic economy. These linkages have led to a high degree of correlation between Germany and Chinese equities in the past. However as shown in Chart 2, the correlations have weakened of late. Correlations between German equities and China A-shares have fallen from nearly 80% last year to just under 60% more recently, when measured using rolling six months of returns data. Has Germany become less of a developed markets (DM) play on EM growth than it used to be in the past?
The secular shift from investment to consumption in China would suggest it is likely to be so even if correlations rise again in the near term. In the meantime several domestic, idiosyncratic factors reduce the attractiveness of German equities in our opinion.
Chart 2: German equities less leveraged to Chinese market recovery
Source: Bloomberg, April 2019
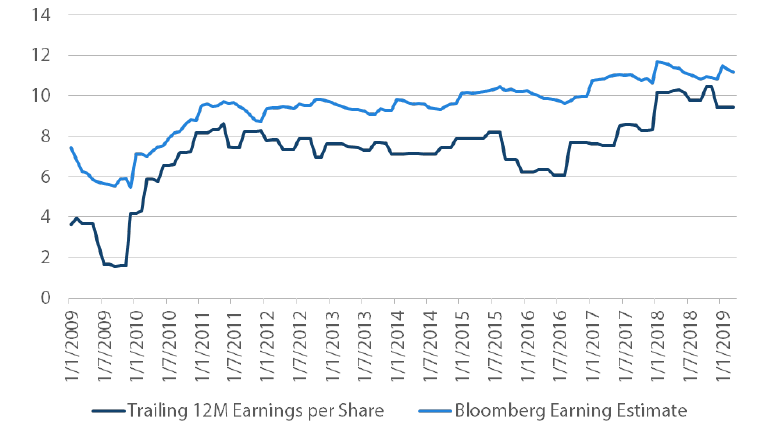
As seen in Chart 3, German corporate earnings have remained sluggish for several quarters. This is not just due to a slowdown in global growth but also weakness in the more domestically-focused real estate and consumer sectors.
Chart 3: Germany equity earnings remain sluggish
Source: Bloomberg, April 2019
The consumer sector has remained one of the bright spots in the German economy over the last few years. The highly accommodative monetary policy of the European Central Bank kept real interest rates deeply negative for German consumers, stimulating both consumption and real estate prices. Employees enjoyed strong gains in real wages which ensured consumer confidence and spending stayed high even against a very uncertain political backdrop. However wage growth has started to come off recently. Household income growth slowed from over 5% year-on-year in 2018 to just over 4% in the latest print.
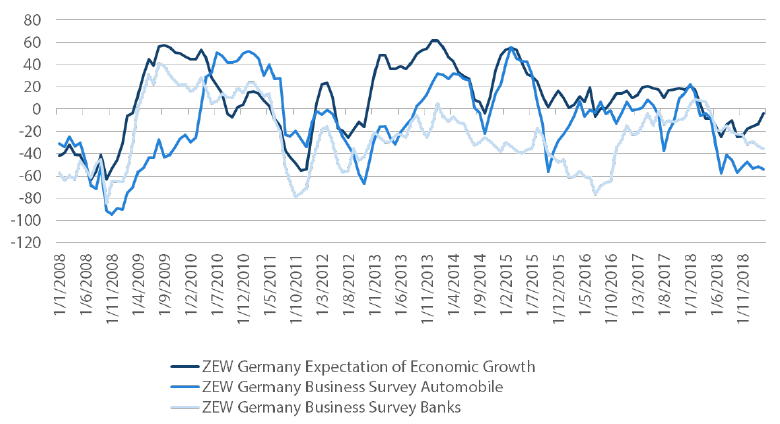
Continued weakness in the manufacturing sector which employs a third of all German workers could turn this one data point into a sustained trend. Capacity utilisation and business sentiment are both depressed. Leading indicators such as new orders have not yet picked up either. The ZEW sentiment survey (Chart 4) shows a small rebound from very depressed levels but the sub-indices for the Banking and Auto sectors have not picked up. With Brexit uncertainty failing to go away it is hard to see improving sentiment across finance and banking services. A potential merger between Deutsche Bank and Commerzbank could lead to either tens of thousands of redundancies or an extended period of weak profitability for the merged entity. The existential concerns of the auto industry are no lower. There is also the rising risk of tariffs imposed by a President Trump freshly victorious from his trade war with China. Longer-term risks to German autos emanate from the generational shift to electric cars where Germany does not possess the competitive advantages of either the United States or China.
Chart 4: Sentiment remains depressed in the banking and auto sectors
Source: Bloomberg, April 2019
Germany has an enviable history of undertaking painful reforms to maintain global competitiveness and we see no reason to doubt that it will be able to engineer the changes needed to yet again adapt successfully. However the road is likely to be bumpy. Hence we prefer to gain exposure to the EM recovery more directly through EM equities in Asia, EMEA and Latin America. Selectivity across individual markets and companies will remain key however.
We also tweak our hierarchy by returning US equities back above Japan, based on macro score improvements for the former. Our scores on monetary policy and the strength of the consumer improve from marginally positive to strongly positive. The Fed pivot to easier policy has halved real rates from their peak of 120 basis points (bps) in 3Q18 to under 60bps, which is right on the five-year average. This means monetary policy in the US is likely to be a strong tailwind at least through the end of the year, and maybe till after the 2020 US presidential election. The consumer sector has been healthy given low unemployment, strong wage gains and buoyant confidence. However the latest data releases also show a pickup in hard data such as retail sales and housing. Clearly the fall in rates and gains in equity markets is manifesting in greater consumer cheer.
The picture in Japan is not much changed. We retain Japan as one of our top three equity markets. Recent growth and inflation numbers have been uninspiring and there is increasing uncertainty around the effect of the upcoming consumption tax hike from 8% to 10%. That said, Japanese equities remain one of the strongest secular growth stories globally on the back of increased margins, profitability and shareholder returns.
Global bonds
Our sovereign bond hierarchy remained unchanged and consistent with our measures of valuation, momentum and macro conditions that were little changed during the month. However, it would appear that market participants saw it differently judging by the sharp falls in global bond yields.
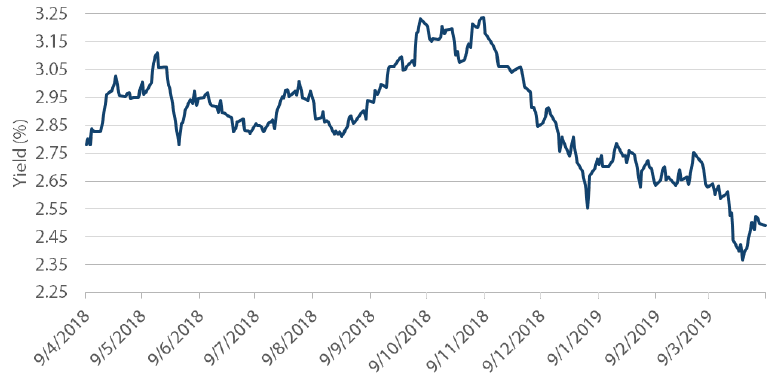
US Treasury bond prices rallied strongly in March with the 10-year yield falling by 31bps. This magnitude was similar to the sharp rally we experienced in December last year when US equities went into free fall, returning -9% for the month. An additional factor in December was the 10% fall in oil prices which followed large declines in October and November, reducing investors’ inflation expectations. Suffice to say, these were two notable factors that lent support to global bonds at the end of last year although neither were present in March, with US equities returning 2% and oil prices up by 5%. While sharp falls in bond yields are often associated with safe haven buying during risk-off periods, this did not appear to be the case last month.
Chart 5: US 10-year treasury yield
Source: Bloomberg, April 2019
If we look back at the news items that dominated headlines in March, two that stand out are rising concerns for global growth and the Federal Open Market Committee (FOMC) meeting. The picture painted here was that poor manufacturing PMI releases in the Eurozone were indicative of an impending global recession and the FOMC’s indication of a pause in the normalisation of rates was actually a first step to policy easing later in the year. While we also have our concerns about the recent economic performance of the Eurozone, these are not likely to upset a US economy which is not overly reliant on trade for its growth. It also stands to reason that with US unemployment at 30-year lows and with consumer and business confidence remaining at elevated levels, the FOMC is unlikely to be on the precipice of cutting cash rates. As a result, the bond market appears to be getting ahead of itself in extrapolating from some softness in Q1 data to a global recession and a fresh round of monetary stimulus from the Fed. We do not expect either of these outcomes in 2019 and view current levels of global bond yields as too low.
Global credit
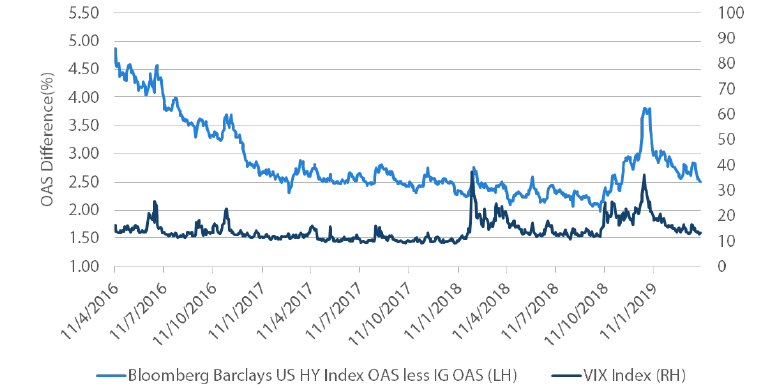
The positive US economic backdrop has benefited corporate bond spreads over the last three years. And as one would expect, high yield (HY) spreads have contracted more than investment grade (IG) spreads over this same period. This has also coincided with generally low volatility throughout 2016-17 with only the occasional blip. However, in 2018 we experienced two volatility shocks, one to start the year and the second to end the year. In both cases, HY spreads pushed higher although the latter episode saw a much greater reaction. We put this down to the February scare reflecting a technical factor related to leveraged volatility products whereas the December spike in volatility was more related to global growth concerns, a more serious concern for HY investors.
Chart 6: US Corporate HY less IG Option Adjusted Spreads versus VIX
Source: Bloomberg Barclay Indices, April 2019
Nevertheless, volatility has retreated again in the first quarter which has cleared the way for HY spreads to contract again relative to IG spreads. Although the recovery in spreads has yet to retrace back to the lows of 2018, the premium gained in HY versus IG is historically tight and insufficient in our view to compensate for the additional credit risk borne by investors.
FX
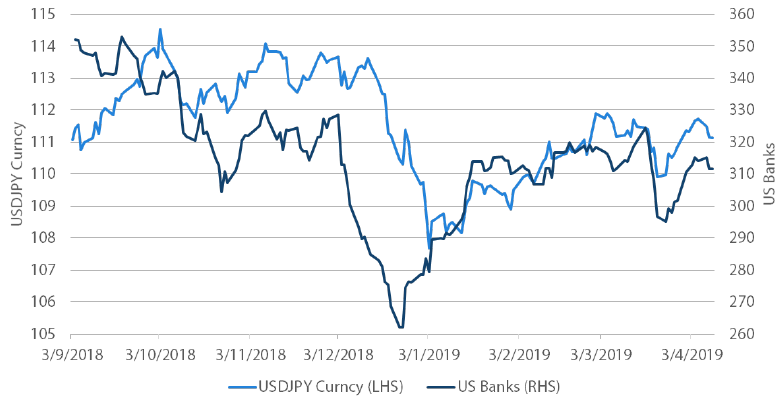
JPY was lifted up the hierarchy to just below GBP and above USD as a function of still tight liquidity conditions and weak carry trade performance causing Japanese investors to repatriate some of their foreign investment, lifting JPY. Chart 7 depicts JPY compared to US banks’ share performance as an indicator of tight financial conditions. While the Fed has pivoted firmly dovish, liquidity remains tight as it continues to run off its balance sheet.
Chart 7: JPY versus US banks’ performance
Source: Bloomberg, April 2019
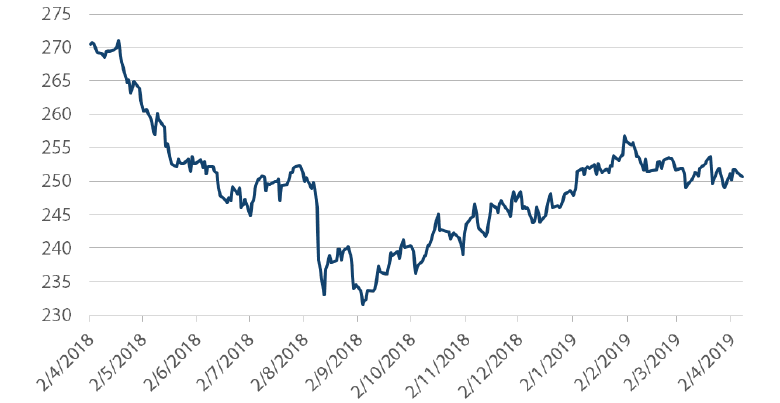
Still-tight liquidity means that fragility will continue to be exposed. Following the deep sell off in EM currencies through August of last year, the carry trade on EM currencies has actually paid off since September as a function of Turkey and Argentina reverting to firm orthodox policies and the Fed turning more dovish. But cracks are once again forming, as both Turkey and Argentina have been showing signs of stress on the recognition that new policies may be falling short.
Chart 8: FX Carry Trade Index 8 Emerging Market Currencies
Source: Bloomberg, April 2019
The return of risk appetite has been hard and fast since late 2018, and while it is tempting to extrapolate positive developments to a continued uptrend, valuations are less compelling and given the evidence of tighter liquidity conditions coupled with pockets of EM stress, the upgrade of JPY is an appropriate reflection of our caution.
Commodities
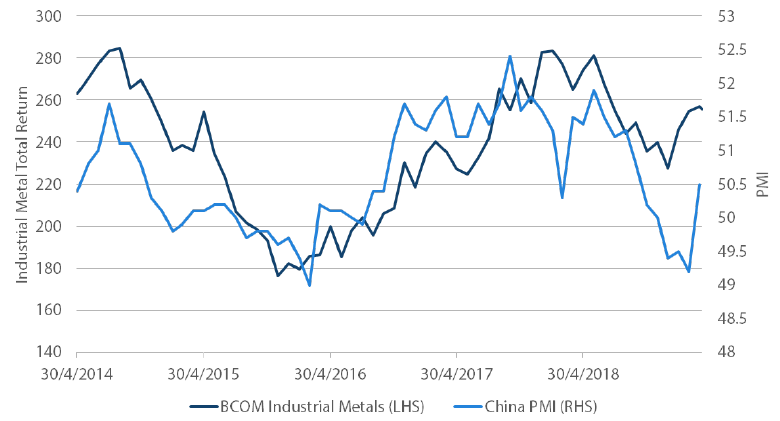
Over the past quarter, commodities have responded positively to improvements in sentiment, with the complex enjoying its second-best quarter of the last five years, only after Q2 2016. Indeed one can draw similarities between the two mini-cycles, with China reflating and a dovish Fed, apart from the trade negotiations. However, China appears more restrained this round, focusing on consumption and pushing out targeted measures instead of flooding the economy with liquidity. For this reason it is surprising that industrial metals in 1Q19 outperformed their 2Q16 returns by almost 6%. Have the metals run too far ahead of fundamentals?
It appears so when comparing industrial metals to China’s PMI before the encouraging print for March (50.5, consensus 49.6, prior 49.2), where the 1.3 point improvement from February is the strongest in five years. With a still substantial gap to close, it is prudent to watch data releases from China for confirmation. We will also be monitoring trade negotiations between the US and China. While we are positive that the economy will stabilise in the coming quarters, keeping industrial metals supported, we believe the upside to industrials is less than it was three months ago.
Chart 9: Industrial metals versus China PMI
Source: Bloomberg, Nikko AM, April 2019
Process
