Entering 2019, our key theme was emerging market (EM) headwinds turning to tailwinds: a US-China trade deal getting done, a US Federal Reserve (Fed) pivot to dovishness, growth returning to China, and all of the above helping to contribute to a more stable (if not weaker) dollar allowing for growth to spread more broadly. So far so good on these themes coming to fruition, and taking risk in Q1 has certainly paid off.
Our key signpost that poses a risk to this otherwise rosy outlook is still relatively tight global liquidity. We think of global liquidity as sourced from central banks and private sector credit creation. On the credit side, liquidity has rebounded, particularly in China where the credit impulse has firmly advanced to the upside.
However, central bank (CB) liquidity matters too, and here we grow more cautious. Why? Tight CB liquidity often goes hand in hand with a stronger dollar and returned stress to vulnerable economies like Turkey. We are seeing this partially unfold now, but private credit creation among higher quality EMs is an offset to tighter CB liquidity, which is why quality EM remains the best exposure.
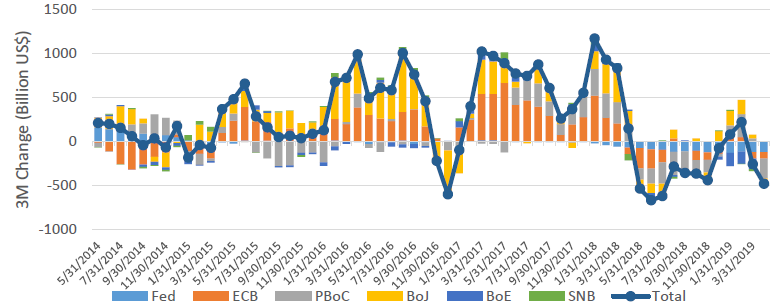
The Fed may have pivoted dovish, but the current plan is to continue shrinking the balance sheet until September 2019. Since liquidity – or lack thereof – sloshes across borders and around the world, we analyse the change in aggregate CB balance sheets (call it the CB impulse), including the major developed market (DM) CBs as well as the People’s Bank of China (PBoC).
As shown in Chart 1, the Fed has continued to detract from the impulse while in late 2017 / early 2018, it was the PBoC and Bank of Japan (BoJ) that kept the impulse positive up until just the last few months. Both CBs are now detracting from liquidity – especially the PBoC – causing the overall CB impulse to be negative and therefore global liquidity to be tight. In this quarterly report, we will reflect on how a positive credit impulse in China and generally tight CB liquidity impact different geographies and asset classes across EM.
Chart 1: Aggregate central bank liquidity negative again
Source: Bloomberg, April 2019
Asia growth eases, while valuations are attractive on earnings momentum
North Asian equities were upgraded – China to positive for improving growth dynamics while Taiwan and South Korea were lifted to neutral on early evidence of the technology hardware cycle and global trade bottoming out. China stimulus is more consumption-oriented, so we see the benefits extending across the private sector and therefore the Asian supply chain.
India was left at neutral-negative despite the optimism surrounding elections, favouring Modi and potentially a “no hung” parliament that would be the best case scenario allowing Modi to efficiently push his reform agenda. However, growth and earnings are still relatively weak, suggesting asymmetric risks to the downside if the result is less than fully positive. Rising oil prices is also an increasing headwind to Indian markets.
ASEAN remains a positive growth story, but we see more positive developments in the north that justify a partial rotation. Indonesia had been a top performer starting in October of last year with momentum shifting positive in Q1, but expensive valuations in light of still-moderate earnings justified a downgrade.
Asset Class Scores
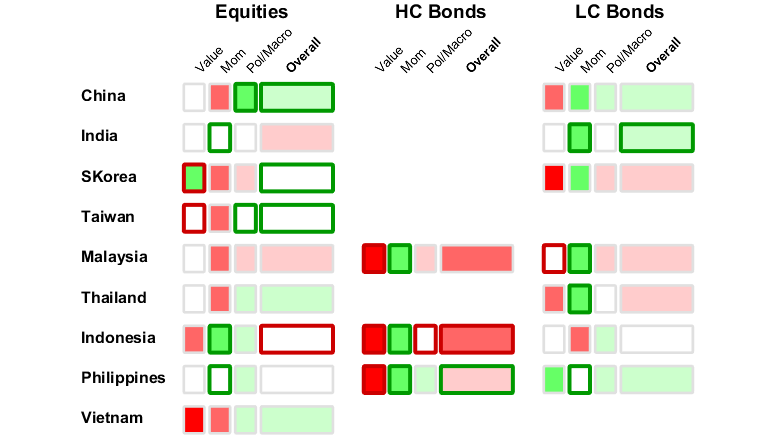
Score Summary: For each country and asset class, scores are represented by colours – white is neutral, green is positive and red is negative. The overall score is shown to the right with the underlying scores – value, momentum and political/macro – shown to the left. The border shows grey for no score change, while green shows positive and red negative.
The asset classes mentioned herein are a reflection of the portfolio manager’s current view of the investment strategies taken on behalf of the portfolio managed. These comments should not be constituted as an investment research or recommendation advice. Any prediction, projection or forecast on sectors, the economy and/or the market trends is not necessarily indicative of their future state or likely performances.
China’s green shoots of growth
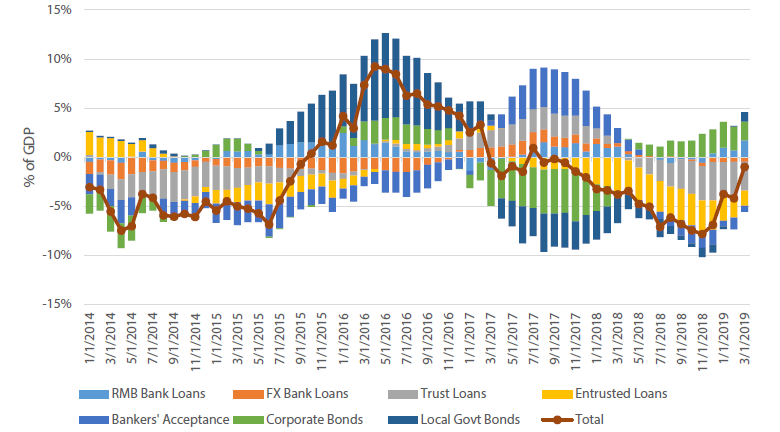
The credit crunch is finally coming to an end as curtailed shadow bank lending is finally being offset by increased bank loans and corporate bond issuance as reflected in the China credit impulse shown in Chart 2.
Different than previous bouts of excessive lending to state-owned enterprises (SOEs) for (mis)investment, credit is finding its way to more efficient deployment through the private sector. This is a significant shift in policy for several reasons. First, the private sector previously had little access to bank financing because it was effectively crowded out by SOEs, forced to turn to far more expensive shadow banking sources of funding. Private sector access to bank lending greatly reduces the cost of capital and therefore increases profitability.
Chart 2: China credit impulse
Source: Bloomberg, April 2019
Second, the stimulus being directed to consumption over investment means that the private sector can expect to see improving top line growth through domestic demand. Third, the value-added tax (VAT) cut means not just increased consumer demand but also higher profitability in terms of lower inputs costs for higher margins.
The bottom line is that the current China stimulus is different this time – following through on its pivot from the quantity of growth to the quality – which benefits the private sector and therefore investors. So far, A-shares have been the primary beneficiary of this policy pivot with MSCI inclusion being a further tailwind.
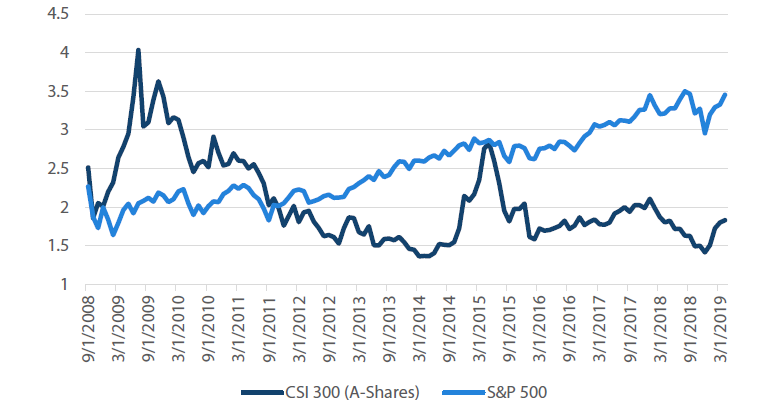
A-shares are up over 30% year-to-date (YTD) , giving some pause on the speed of the rally, but they remain more than 10% below the 2018 high while US equities are reaching all-time highs. Therefore, the valuation gap continues: on a price to book basis, A-shares continue to look cheap compared to history, whereas the S&P 500 is as expensive as it has ever been over the last 10 years.
Chart 3: Price to book compared: China A-shares versus S&P 500
Source: Bloomberg, April 2019
Still finding value in Asia bonds
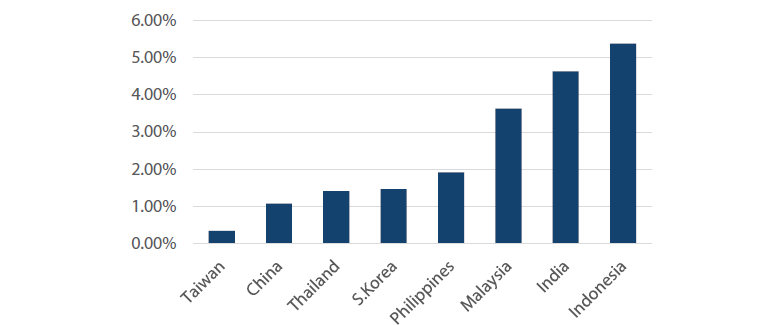
Asian equities are attractive, but so are local currency bonds that benefit from a Fed pivot to dovishness, still attractive real yields – Indonesia and India, in particular – and easing inflation pressures allowing India to cut rates with others likely to follow in the coming quarters. The primary risk is a resurgence in dollar strength despite the Fed pivot. Our belief is that if financial conditions tighten and the pace of dollar strength escalates, the Fed may stop rolling off its balance sheet sooner than later, which would likely ease pressures.
Chart 4: Asia real yields
Source: Bloomberg, April 2019
EMEA divergence continues
Once again, the southern part of the region is deteriorating, at least partly on the back of the tighter global liquidity conditions outlined in the introduction. The north is less vulnerable to tighter liquidity conditions because of strong credit in Eastern Europe and robust macro fundamentals in Russia that help to immunise its economy from external liquidity shocks.
Turkey has again taken a turn for the worse, shaking market confidence by reverting to unorthodox policies and lacking an adequate reform plan to ever find its way out. In South Africa, despite further fiscal slippage, the country crucially managed to avoid a Moody’s downgrade, which led us to upgrade it on our hierarchy, albeit with a strong caveat to monitor its deteriorating debt dynamics.
Central and eastern Europe remain surprisingly resilient despite weakness in Europe and monetary policy that still looks like it is overheating at home – Hungary and Romania in particular. Even still, earnings remain strong offering selective high quality opportunities.
Russia is running twin surpluses – fiscal and current account – helping the currency to be a top performer year-to-date. Also, the Mueller report reflecting “no collusion” reduces near-term determination for more US sanctions, but findings that Russia did in fact interfere with US elections means that sanctions could still be in the pipeline.
Asset Class Scores
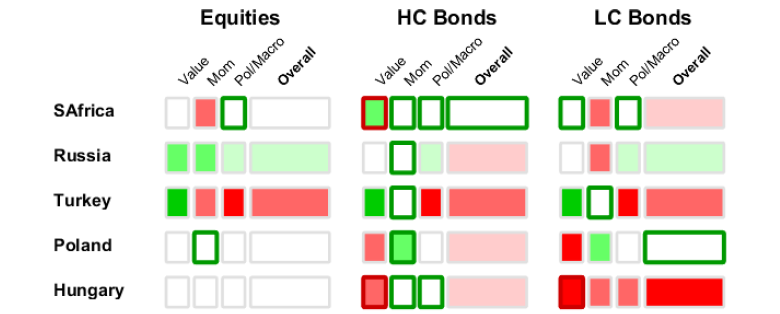
Score Summary: For each country and asset class, scores are represented by colours – white is neutral, green is positive and red is negative. The overall score is shown to the right with the underlying scores – value, momentum and political/macro – shown to the left. The border shows grey for no score change, while green shows positive and red negative.
The asset classes mentioned herein are a reflection of the portfolio manager’s current view of the investment strategies taken on behalf of the portfolio managed. These comments should not be constituted as an investment research or recommendation advice. Any prediction, projection or forecast on sectors, the economy and/or the market trends is not necessarily indicative of their future state or likely performances.
Turkey macro political risk among the highest across EM
Turkey worked hard after the August 2018 bloodbath to regain market confidence through a return to orthodox policy in the form of higher rates and reforms to rebalance the economy. The policies seemed to be working – at least in the form of flipping the current account (C/A) from deep deficit to a surprising surplus.
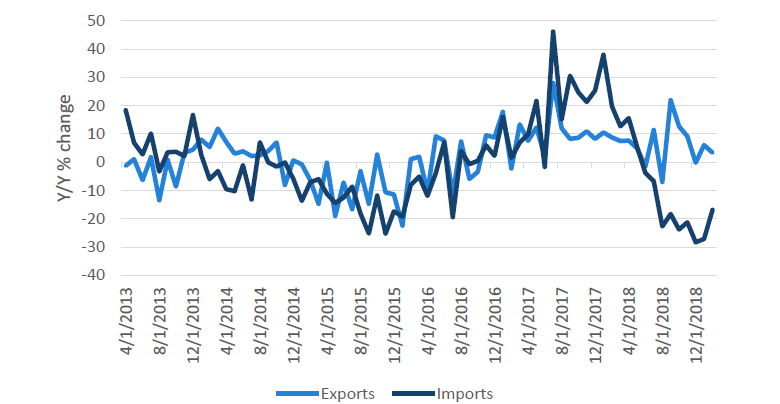
However, as shown in Chart 4, the C/A surplus was achieved only as a function of collapsing imports driven by a harsh negative adjustment in local demand while exports have generally deteriorated since mid-2017 as European growth has continued to disappoint.
In late March, the currency sold off by 6% in a single day following a downgrade by JP Morgan (pointing to dangerously low FX reserves) coupled with a weaker-than-expected reported PMI out of the EU, suggesting perhaps even weaker exports just as imports have begun to rise, at least partly driven by rising oil prices.
Chart 5: Turkey exports vs imports
Source: Bloomberg, April 2019
Worse than the sell-off was the central bank’s (CBRT) reaction, which was to effectively choke off liquidity for hedging (or shorting) the currency. Shorts were squeezed to temporarily support the currency while investors were forced to sell Turkish assets for the inability to hedge currency risk.
Liquidity has since returned for FX hedgers, but the damage to credibility has already been done and the currency continues to sell off to new lows. The CBRT has continued to attempt to support the currency, burning already low reserves to fumes, apparently resorting to short-term swaps to fund support, meaning reserves are actually much worse than they appear.
Turkey will ultimately have to be bailed out by the IMF, but is loath to do so, which means the pain will likely continue before eventual capitulation. Contagion risk is still remote as there are only a handful of banks – mainly in Spain – that are most exposed. Still, aftershocks can reverberate across EM so we continue to watch Turkey very closely.
South Africa elections in May
The general election will be held May 8th where polls suggest the ANC party is likely to maintain its majority, providing a sufficient mandate for President Ramaphosa to push his business-friendly reform agenda.
To date, President Ramaphosa has walked a fine line to maintain the support of his highly divided ANC party, factions of which are pursuing a contentious populist agenda, while keeping an eye on the long term goal of reforms designed to return the country to a sustainable fiscal path.
Assuming Ramaphosa achieves a clear mandate, the key signposts to watch will be business confidence and the extent and pace of structural reforms. Ramaphosa is well regarded and committed to business-friendly reforms, but given the divisions within the ANC party, there are numerous potential roadblocks that will need to be watched closely.
LatAm sees slowing reform momentum
Markets were perhaps overly optimistic on reform prospects both in Brazil and Argentina. Reforms have not stalled, per se, but by definition reforms are painful which necessarily means that they take time and sometimes they do not make it at all. The bottom line is that the process will be lengthy and painful.
In Brazil, President Bolsonaro’s popularity slipped, which has emboldened Congress to delay and dilute pension reform with fiscal savings now estimated to be cut in half from the original proposal. Cutting pension benefits was never going to be popular, so Bolsonaro losing momentum is not a surprise. While risks remain elevated, the base case is still that the reform passes but the process bears a close watch.
In Argentina, President Macri finds himself in an even deeper predicament as inflation continues to spike while economic activity remains weak – both not surprisingly weighing on Macri’s popularity. The IMF delivered a USD 10.8bn tranche in early April to reduce near-term pressures on the currency, but reducing inflation and returning growth will be key for Macri taking the October presidential election.
Conversely, Mexican politics appears less awful than markets priced. President Lopez Obrador (AMLO) is currently struggling with a downgrade to Pemex further pressuring fiscal dynamics, but at least he is responding with measures, such as pension reform, to keep fiscal dynamics in order – all in all, perhaps less populist than some had feared.
Asset Class Scores
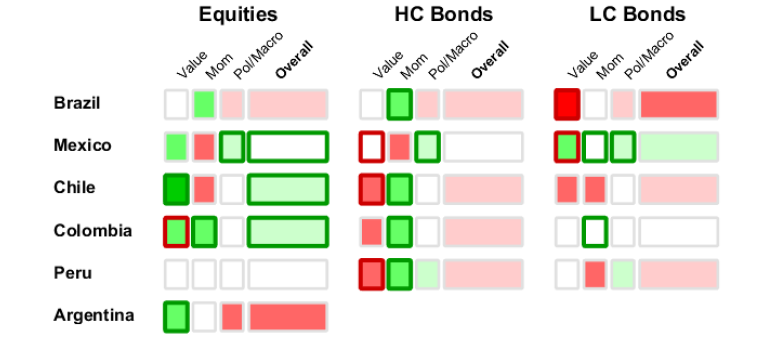
Score Summary: For each country and asset class, scores are represented by colours – white is neutral, green is positive and red is negative. The overall score is shown to the right with the underlying scores – value, momentum and political/macro – shown to the left. The border shows grey for no score change, while green shows positive and red negative.
The asset classes mentioned herein are a reflection of the portfolio manager’s current view of the investment strategies taken on behalf of the portfolio managed. These comments should not be constituted as an investment research or recommendation advice. Any prediction, projection or forecast on sectors, the economy and/or the market trends is not necessarily indicative of their future state or likely performances.
Chile and Colombia equities relatively cheap
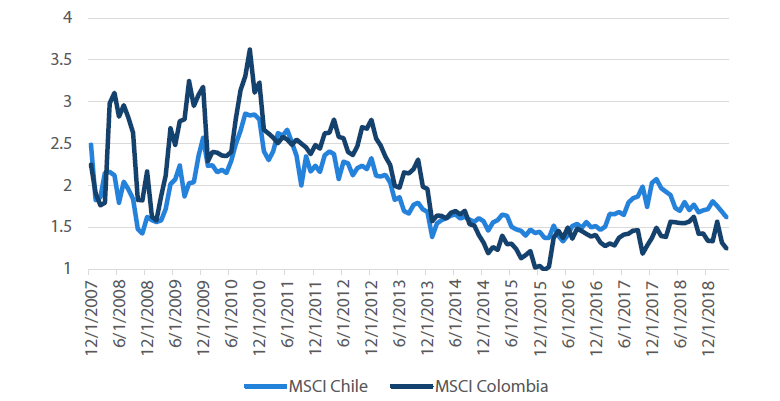
While commodity markets have experienced a healthy bounce since late last year along with other risk assets, little attention has been paid to the commodity exporters. Colombian equities have popped a bit with momentum shifting positive on the back of a recovery in oil that it exports, but Chile equities are flat this year, despite a recovery in copper (its primary export). In both cases, markets appear cheap as shown in Chart 6.
Chart 6: Chile and Colombia equities price to book ratio
Source: Bloomberg, April 2019
Part of the lack of enthusiasm for commodity exporters is based on the premise that China stimulus is different this time – more consumption-oriented than investment and therefore less likely to lift commodity demand and prices as it has done in the past. This is true, in part, but China stimulus does include an infrastructure investment component and with global growth more generally stabilising, the commodity story is still positive.
Colombia equities are up over 20% YTD, given the bounce in oil. Chile is basically flat even though copper is up 10%. Chile is a more diversified economy than Colombia, and data did look weak in 4Q18, with unemployment rising on the back of a seasonal contraction in mining. But overall, both economies are reasonably healthy with upside potential for business-friendly reform agendas.
Argentina inflation keeps rising
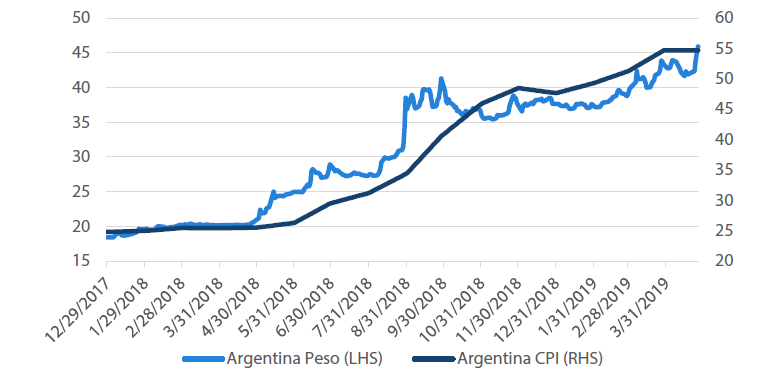
The IMF approved a USD 10.8bn tranche of aid on April 5th, which offered temporary support to the Argentina peso, but slippage continues as inflation keeps surprising on the upside. Chart 6 shows CPI at 55% year-on-year (YoY), to the upside as President Macri’s popularity keeps slipping. Even more ominous, Cristina de Kirchner’s popularity is going up, indicating at least some want to return to the dark days of her administration that decimated the country’s economy.
Chart 7: Argentina inflation versus currency
Source: Bloomberg, April 2019
The presidential election is not until October, but the time is getting near in light of still disappointing economic data and a deteriorating inflation outlook. Inflation and economic growth are obviously two key signposts that will guide popular support for Macri and his ability to win another term to continue with his reform agenda.


