Snapshot
Market confidence quickly turned to panic in early May as Trump shocked the world (again), threatening to lift tariffs on China imports from 10% to 25% on USD 200 billion worth of goods—dashing expectations for a signed deal that seemed just around the corner. Fortunately, negotiations continue but as brinksmanship returns to the global stage, the uncertainty it creates in its wake potentially risks another pullback in global demand. We don’t think we are there quite yet.
Our base case remains that a deal will get done because both sides badly need it and negotiations never would have progressed to the extent that they have without there being a visible road to compromise and strong intent from both to get it done. This seems to suggest that we will see more 11th hour tactics, with each side pressing for a slightly better deal rather than a sudden realisation that there is an insurmountable deal breaker.
As an asset manager, it is frustrating to see the return of blustering rhetoric that invariably drives markets. Trump’s obsession with US equity performance is well known, and had the S&P 500 not been making new highs, his shift in tactics might not have been so bold. Different than in 2018, the US no longer has the fiscal stimulus tailwind and China growth is far healthier, so the match is far more even than some may think.
We expect volatility to continue as tariffs go up, but we also expect negotiations to continue. Will new tariffs be added, continuing to roil markets? China will likely respond in kind, and Trump looks set to at least start the process for applying tariffs to the rest of China imports which will take time, but if it pushes forward, a sell-off akin to Q4 of last year would seem likely—this time without Federal Reserve (Fed) Chairman Jerome Powell to blame. More likely, threats will go dormant and negotiations will continue to get a deal done.
Trade deal negotiations aside, global demand continues to gather pace in China, the US and now even Europe with both growth and earnings surprising to the upside. The China credit impulse is firmly positive, this time uniquely attributable to the private sector which breeds a far healthier allocation of capital and therefore sustainability. The headline induced sell-off in China A-shares could well prove to be an excellent entry point if trade negotiations get back on track as we think they will.
The nagging concern is that while central banks have publicly pivoted dovish, liquidity is still being withdrawn – recently, driven by the People’s Bank of China (PBoC). This is not a concern in and of itself but can be a headwind when coupled with a stronger dollar that has gathered pace over the last month and now has accelerated with the return of trade war tensions. The pick-up in the China credit impulse is an effective offset, meaning that global demand need not contract but the balance is delicate and warrants a close watch.
Asset Class Hierarchy (Team view1)
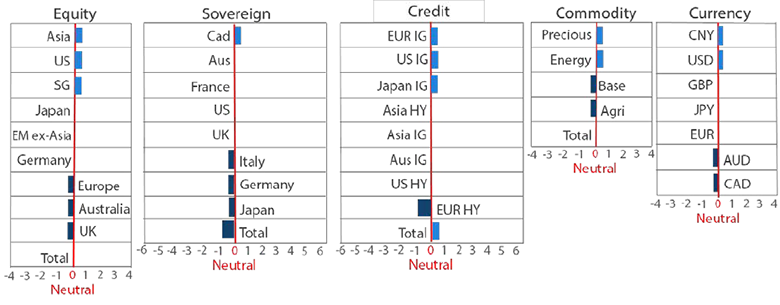
Note: Sum of the above positions does not equate to 0 in aggregate – cash is the balancing item.
1The asset classes or sectors mentioned herein are a reflection of the portfolio manager’s current view of the investment strategies taken on behalf of the portfolio managed. These comments should not be constituted as an investment research or recommendation advice. Any prediction, projection or forecast on sectors, the economy and/or the market trends is not necessarily indicative of their future state or likely performances.
Research Views
We make adjustments to our asset class views and hierarchies as discussed below.
Global equities
We retain our constructive outlook on equities but downgrade Japan equities one notch on our relative equities hierarchy.
Equity markets are likely to remain volatile over the next few weeks. However it may be too early to throw in the towel just yet. There are three assumptions that underpin our continued faith in equities, and risk assets more broadly:
- Equities enjoy a reasonable amount of valuation support at current levels.
- Chinese policy will prove effective in backstopping the domestic growth slowdown.
- A US-China trade deal will get done eventually.
Our reasons for believing in an eventual deal were mentioned in the introduction, and we have previously discussed the green shoots of economic data coming out of China.
Low inflation uncertainty, easy monetary conditions and the low probability of an economic recession this year and next (barring any trade shocks) create a supportive macro backdrop for equity market valuations. At current levels, equities are cheap both relative to bonds and relative to their long term history.
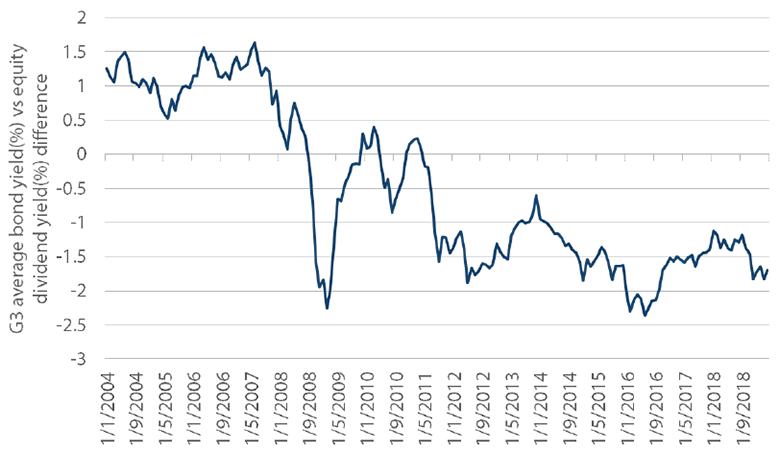
As an indicator of the former, Chart 1 shows the spread between G3 sovereign bond yields and dividend yield on global equities historically. The current spread of nearly 200 basis points (bps) is at historical extremes suggesting equity undervaluation relative to bonds.
Chart 1: Global equity inexpensive relative to bonds
Source: Bloomberg, May 2019
Equities are also inexpensive relative to their own history. This is true even after the strong gains this year.
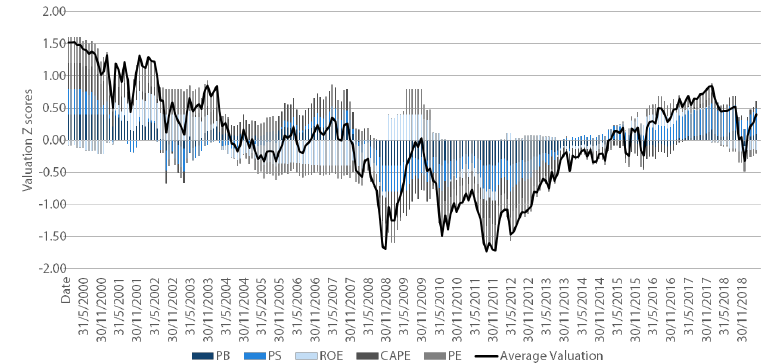
Chart 2: Global equity inexpensive relative to history
Source: Bloomberg, May 2019
Chart 2 presents a perspective on global equity valuations by equally weighting the extent of divergence of five key valuation ratios for global equities from their long term averages.
The ratios are Price to Book, Price to Sales, Return on Equity, Cyclically Adjusted Price to Earnings and Price to Trailing 12 month Earnings. The bold line is the weighted average valuation indicator of these ratios while the contribution from each component is shown using the stacked bars. The data is normalised such that the x-axis is the average value. A simple heuristic that considers fair valuation zone to lie within one standard deviation (+/- 0.5) of the average would suggest that global equities are indeed fairly valued at this time.
The recent escalation in trade war rhetoric and continued lack of inflationary pressures are both likely to induce continued monetary easing globally and keep equity multiples well supported for now.
The risk is that it all spirals out of control and valuations de-rate due to worsening of economic momentum and rise in risk aversion. So long as this is not the base case it would support the case to stay overweight equities, but it would also be wise to start building in some downside protection for a bout of further risk-off over the summer.
Japan equities
Japanese equities offer secular growth at reasonable valuations. We remain constructive longer-term given the growth in margins, profitability and shareholder returns. However we trim our nearer term view a notch given increasing risks on the horizon, both domestically and externally.
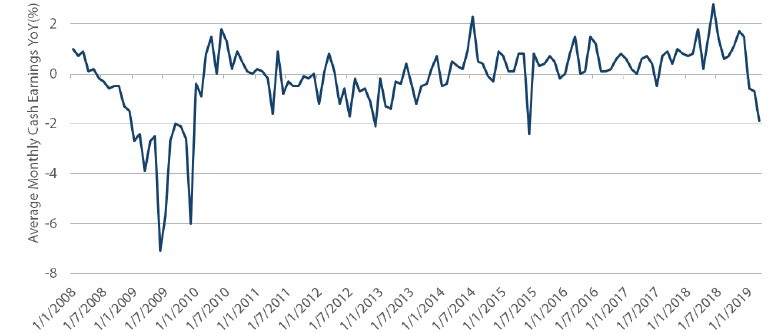
The consumption tax hike planned for October is coming at a bad time for Japan given weak income growth. Japan’s March wage data shows further challenges emerging to Bank of Japan’s reflationary policy. As shown in Chart 3, cash earnings fell 1.9% year-on-year (YoY) which was the worst drop since 2015 and may do little to improve consumer confidence and consumption.
Chart 3: Risks to Japan consumption
Source: Bloomberg, May 2019
A recovery in global demand, particularly from China, would hence appear to be key for Japan to avoid a recession. But with industrial production and real exports both still disappointing and US-China trade negotiations at a critical juncture we believe it might be prudent to adopt a tactically more cautious view on Japanese equities.
Global bonds
The primary change to our sovereign bond hierarchy this month was a downgrade for Australian government bonds to a neutral weight. This leaves Canada as our preferred sovereign bond exposure after a long reign for Australian bonds at the top.
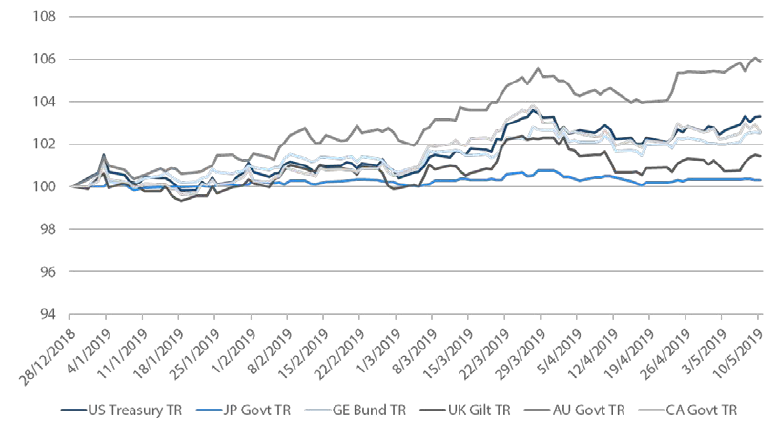
Australian government bonds have been a very strong performer this year, leading the other major sovereign markets by a wide margin. Across the major markets in local currency terms, Japan has eked out a small positive return at the low end and US treasuries have come closest, but still lagged Australian returns by over 2.5%. While our outlook for Australian bonds has not changed markedly, the market is now more fully pricing our view that Australian bond yields were too high relative to peers.
Chart 4: Year-to-date performance of 7-10 year sovereign bond markets
Source: Bloomberg, May 2019
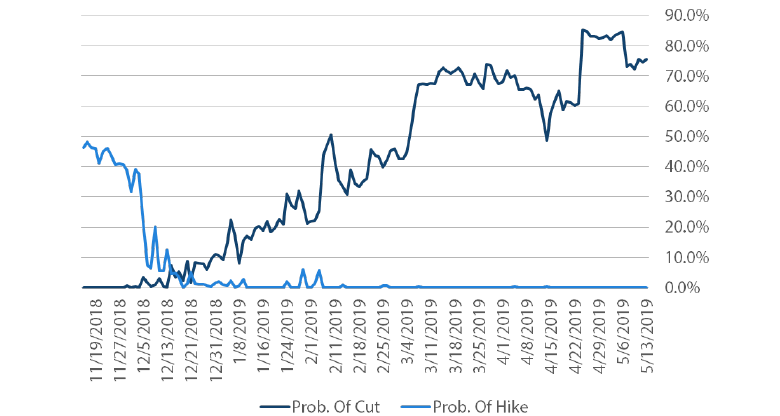
This change in pricing has been most evident at the short end of the Australian yield curve. Only six months ago, Australian interest rate futures were priced for hikes, with no chance of easing, in the Reserve Bank of Australia (RBA)’s official cash rate target. Today, the outlook for Australian monetary policy has done an about face and markets are now priced for lower cash rates in 2019. The probability of an interest rate cut by the time the RBA’s September meetings comes around is 75% and the chance of hikes is stuck at zero. RBA guidance has softened in recent months as inflation remains mired below its 2-3% target range and a slowdown in housing has taken its toll on consumers. This change in market expectations over the last six months has driven the strong returns for Australian bonds. However, this readjustment process is now largely complete in our view and we expect Australian bonds to perform more in line with peers in the period ahead.
Chart 5: Probability of changes to RBA official cash rate
Source: Bloomberg, May 2019
Global credit
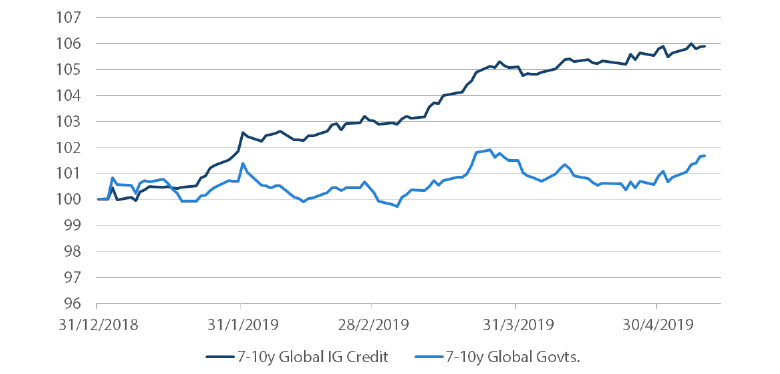
Global credit markets have performed strongly this year, beating sovereign bonds handily. Within credit we continue to prefer investment grade corporates over high yield on valuation grounds. High yield spreads have compressed to the point where equities offer a better value proposition in most cases when seeking growth returns.
Chart 6: Global credit versus government returns
Source: ICE BAML Indices, May 2019
FX
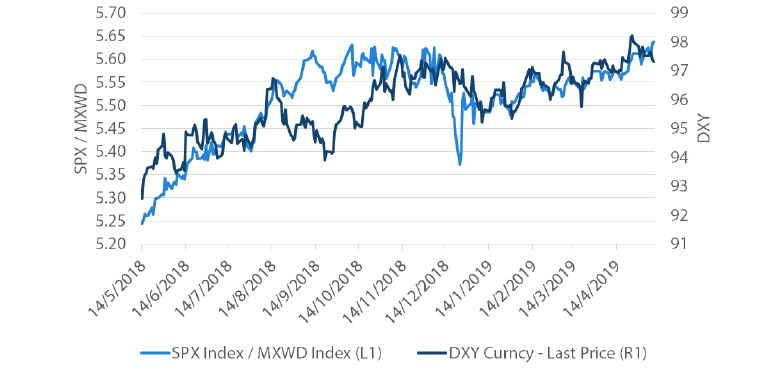
USD was lifted up the hierarchy to just below CNY. USD actually peaked relative to emerging market currencies in early September 2018, but has been grinding higher again since the end of January with the exception of CNY that continued to remain bid on the prospect of a trade war resolution which will need to be revisited at the next research meeting.
USD strength can be associated with tighter financial conditions and / or portfolio flows that favour US assets over the rest of the world. Today, we think it is a bit of both. In recent months, central banks have been reducing their balance sheets in the aggregate, this time driven not just by the Fed but also the PBoC. Of course, the recent “risk off” sentiment also tightens financial conditions, which contributes to dollar strength.
After US equities strongly underperformed the rest of the world in December of 2018, they have again outperformed the rest of the world, giving a boost to the USD. US GDP growth for 1Q19 surprised on the upside, helping to further bolster portfolio inflows. China A-shares had been the strongest performing equity market, but the return of trade war concerns has caused some to take profits and perhaps rotate the proceeds back into US equities which have proven defensive.
Chart 7: S&P 500 relative performance to MSCI All World versus the Dollar (DXY)
Source: Bloomberg, May 2019
The return of JPY strength is noteworthy, but more indicative of “risk off” sentiment where, again, our base case is that trade negotiations continue to help appease markets.
Commodities
On 22 April, the Trump administration ended sanctions waivers for countries importing crude oil from Iran, determined to drive its exports to zero. Crude oil prices rallied initially following the news, but subsequently lost steam quickly and actually declined by 7% within the next two weeks. While President Trump’s tweets demanding that OPEC pump more oil may have been a partial contributor to the pull-back, our research indicates that supply risks caused by lapsing waivers is less of a concern than headlines have suggested.
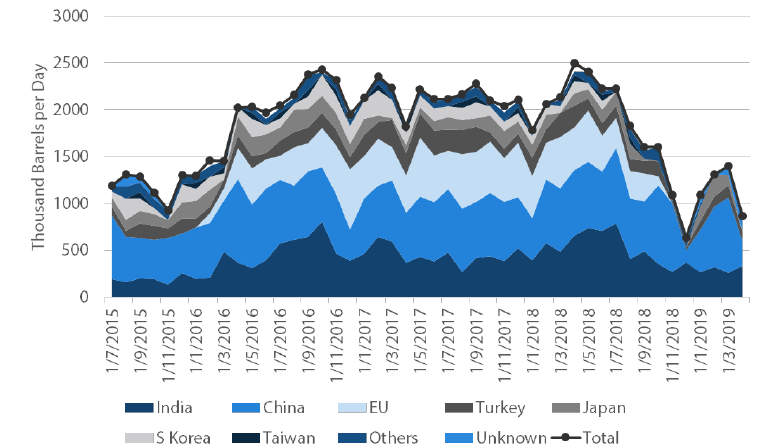
Chart 8: Iranian crude oil exports
Source: Bloomberg, May 2019
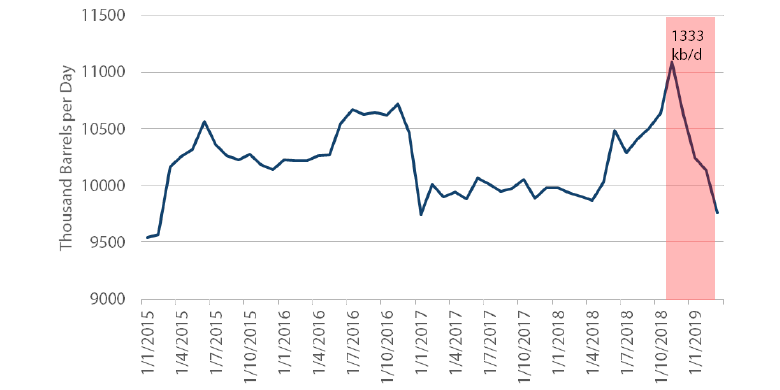
Chart 8 above shows that Iranian exports have slumped significantly from almost 2.5 million barrels per day prior to May 2018, when the Trump administration pulled out the Joint Comprehensive Plan of Action (JCPOA). Saudi Arabia and OPEC ramped up production in preparation of full sanctions back in November 2018 and, as a result, almost ran out of spare capacity by October 2018. However, Iran’s exports have fallen to 1.3 million barrels in March 2019 and just 867,000 barrels in April, with only India, China and Turkey listed as major importers. From chart 9 below, Saudi Arabia alone has the capacity to plug this gap, should it reverse the production cuts it has made since the December 2018 OPEC+ meeting.
Chart 9: Saudi Arabia Crude Oil Production
Source: Energy Intelligence Group, Bloomberg, April 2019
Nevertheless, supply is indeed tighter and there is less capacity to cover potential losses from elsewhere, including Venezuela, Angola and Libya. There is also risk should Iran decide to retaliate and blockade the Strait of Hormuz. These factors should keep the crude oil risk premium supported.
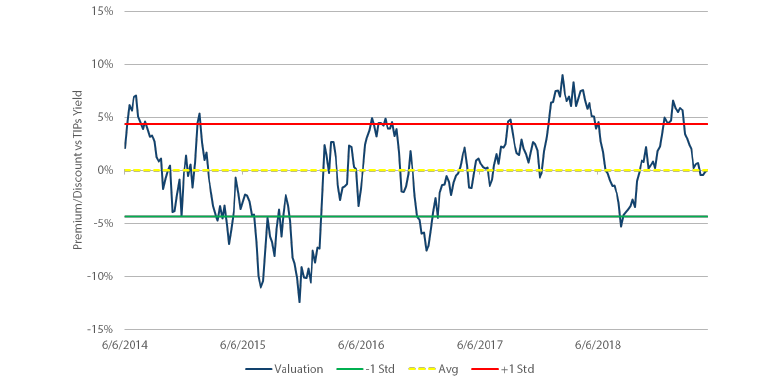
Having lost some of its shine this year, we think gold is a better instrument to hedge for potential broader geopolitical risks such as the US-China trade negotiations, North Korea missile tests, and European elections. It is now also fairly valued according to our model, as shown in Chart 10.
Chart 10: Gold valuation model versus TIPs yield
Source: Bloomberg, Nikko AM, April 2019
Process
