Snapshot
Escalating trade wars put a sudden stop to the market rally last month. Stocks in the US and China both fell by about 6% while Emerging Market (EM) equities (-7.5%), Copper (-10%) and Oil (-16%) all ended sharply lower. While the moves were shallower than at the end of last year they were just as dramatic given how perfect the backdrop had appeared for risk assets to continue performing strongly. Hence investors are right to question whether this is just a pause in the 2019 risk rally or a more definitive turn in trend. Our base case around further gains to year-end remains unchanged. However the probabilities we ascribe to the tail risks of recession and sharply lower risk assets have moved meaningfully higher.
Markedly higher market volatility is perhaps the most distinguishing characteristic of the current investment environment. Economic activity has held up reasonably well but the escalation in US-China trade tensions has increased policy and economic uncertainty. Not in a long time have economic outcomes been as binary as they are at present.
On the one hand a robust labour market in the US, stronger credit impulse in China and easy monetary policy globally, including in the US where the Federal Reserve (Fed) pulled off a most spectacular pivot from tighter to easier policy earlier this year, suggest a fairly low probability of an economic recession on the horizon. However, on the other hand is a much bleaker scenario of a sharp pullback in global economic activity as higher uncertainty finally breaks the back of capital spending and consumer confidence. Hence, much as we hate to admit it, we expect the investment environment over the next few quarters will be determined in major part by the nature of tweets from the account of Donald J. Trump (@realDonaldTrump).
The transactional style of Mr. Trump’s presidency has made any type of policy forecasting a near impossibility. The approaching US presidential election in 2020 will only accentuate this uncertainty. Extended valuations across many asset classes, not least across US equities and global technology stocks, and tighter liquidity conditions created by a stronger US dollar, are other risk factors that investors must contend with over the next few weeks to months.
The “Powell Put” and expectations that the European Central Bank (ECB) will continue to do “whatever it takes” even after Mario Draghi ends his term as ECB President this October is one silver lining to this bleak outlook. A key risk faced by markets until fairly recently was that central banks would have to tighten policy to fend off rising inflation as output gaps closed around the world. With US unemployment at a post-war low and wages growing at the fastest rate since the Global Financial Crisis the risk that the Fed would inadvertently tighten its way into a US recession was all too real and a key driver behind the Q418 sell off.
However the risk factors discussed above have led to a sharp fall in both realised inflation and in forward-looking inflation expectations which markets have cheered by pricing in as much as three cuts to the Fed Funds rate by the end of the year. We are sceptical however because history shows that central bank easing is not a sufficient tailwind to prop up asset prices when the economy is slipping into a recession. The odds are that we will either get more easing amid the onset of a recession or we will manage to dodge a recession but get significantly less easing than what the market is currently pricing. Neither case looks too great for a sustained rally. After April showers did come May flowers but also came a timely reminder to mind that hedge.
Asset Class Hierarchy (Team view1)
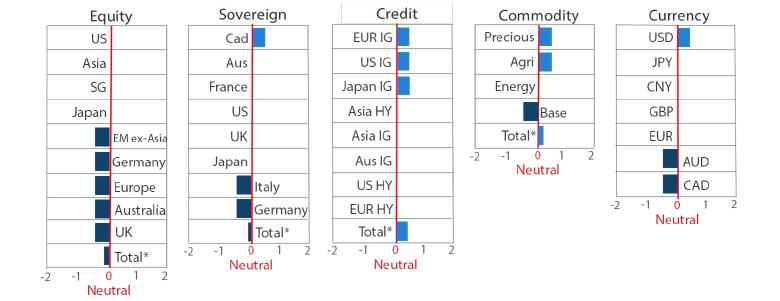
* Total scores for Equity, Sovereign and Credit are weighted average scores, which are computed using market cap weights. The total score for Commodity is an arithmetic average score.
1The asset classes or sectors mentioned herein are a reflection of the portfolio manager’s current view of the investment strategies taken on behalf of the portfolio managed. These comments should not be constituted as an investment research or recommendation advice. Any prediction, projection or forecast on sectors, the economy and/or the market trends is not necessarily indicative of their future state or likely performances.
Research Views
We make adjustments to our asset class views and hierarchies as discussed below.
Global equities
We downgrade our outlook on global equities this month from constructive to neutral on the back of a marginal deterioration in macro scores in both the US and China.
US equities are expensive with middling momentum while China equities are more fairly valued but are enduring a period of negative momentum. Hence our aggregate outlook for both markets slips from just above neutral to neutral. As we are even less constructive on almost all other equity markets globally we find ourselves with no choice but to cut back on our overall equities view to neutral.
Macro downgrade
The macro backdrop was a strong tailwind for both the US and China but this is no longer the case. This is due to a range of reasons that go beyond the trade war and great power rivalry on display between the two nations currently. This is an important point to make as we are fully aware that the trade war narrative could turn on a dime at any point. For instance the upcoming meeting between Presidents Trump and Xi at the G-20 summit in Osaka at the end of June could well usher in a trade truce. Fortunately our macro framework allows us to look beyond such hard-to-predict events.
Investors familiar with our framework will recall that we assign macro scores to each major equity market globally based on our assessment of five key cycles that drive asset prices: Monetary, Fiscal, Consumer, Liquidity and Earnings.
Till last month we had scored the US as neutral or better on all of these based on the indicators that we follow for each. This had in turn led to an outright positive macro score in the aggregate. However this month we downgrade our Fiscal score to just below neutral (N-), Liquidity to neutral (N) and Consumer to just above (N+), with each score coming in one notch lower than the corresponding view in the previous month. Our reasons are as follows:
- Fiscal: the fiscal thrust for the US has moved from a positive tailwind last year to a small negative as the effect of the 2018 tax cut-fuelled fiscal expansion starts to fade.
- Consumer: while still a bright spot for the US economy, consumer confidence data has started to impress less. The Conference Board and University of Michigan consumer confidence indices remain at high levels after the strong bounce from late 2018. However, both missed expectations quite significantly in the last print while other indicators of consumer sentiment such as auto sales and credit card delinquencies are flashing amber at the very least.
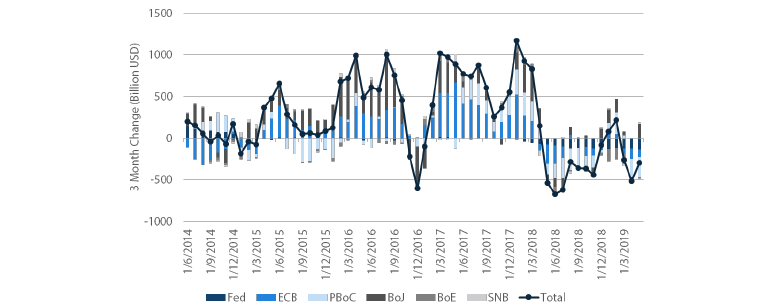
- Liquidity: Despite planning to put a stop to quantitative tightening in September, the Fed is shrinking its balance sheet by USD 40 billion a month, while we also observed reduced support from ECB and the People’s Bank of China (PBOC). Global central banks are withdrawing liquidity from markets, as shown in Chart 1 below.
Chart 1: Global central bank balance sheets
Source: Bloomberg, June 2019
Monetary policy (+) remains accommodative while we believe earnings will continue to beat low expectations. Hence the overall macro score (N+) is still supportive, but just less so.
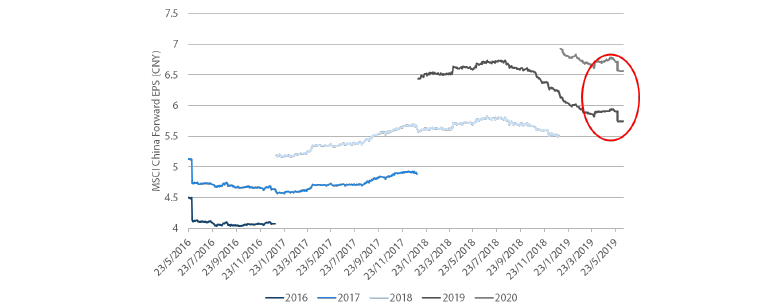
The economic data releases out of China weakened meaningfully in April as policy makers removed some support after a strong start of the year. The combination of this and heightened trade tensions has dented earnings recovery and sentiment, as seen in Chart 2. We have turned to a more neutral stance from a bullish view previously, cognisant of the risk that the government could ease further should the situation worsen.
Chart 2: MSCI China forward earnings
Source: Bloomberg, June 2019
We do see opportunities and stronger returns ahead for specific markets however. May was all about the NaMo and ScoMo show with Prime Minister Narendra Modi and Prime Minister Scott Morrison both returning to power in general elections held in India and Australia respectively.
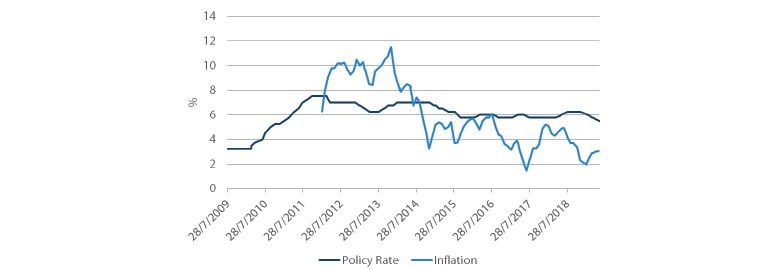
Exit polls had recently moved in favour of a Modi win but markets still greeted the result with a strong relief rally on expectations of policy continuity and further reforms to lift India out of its cyclical growth slowdown and onto a structurally stronger growth trajectory. The Reserve Bank of India too immediately responded with its third 25-basis point (bps) interest rate cut. The supportive fiscal and monetary policy and stable political outlook drive our upgraded outlook on Indian equities this month.
Chart 3: India’s policy rate and inflation
Source: Bloomberg, June 2019
Global bonds
Whilst last month’s change to our sovereign bond hierarchy occurred at the top, this month we have stability at the top and a change at the bottom. We have upgraded Japan government bonds (JGBs) from the bottom of the hierarchy to a more neutral setting.
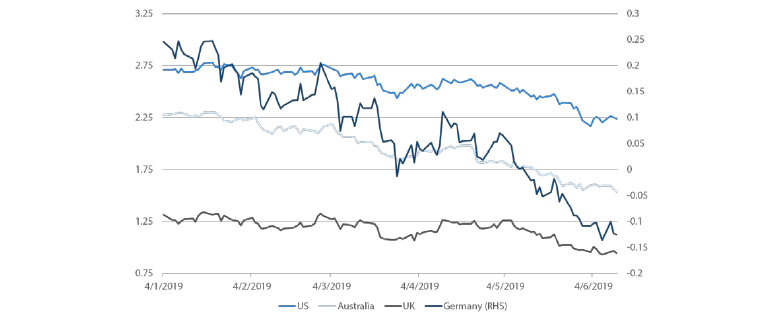
JGBs have been much maligned within the global bond universe, serving as the poster child for ultra-low global yields. In the 10 year maturity, JGBs have remained in a tight 30bps yield range over the last two years with a high of 0.16% and a current yield of -0.11% near the lows. To add insult to injury, JGBs have also lagged the move lower in global yields this year resulting in stark underperformance versus global peers. However, the global fall in yields has also greatly reduced the yield advantage that global government yields have held over JGBs. Chart 4 shows the yield compression of global peers relative to JGBs with German Bunds taking over the title of lowest yielder.
Chart 4: Global government 10 year bond yield spreads versus 10 year JGBs
Source: Bloomberg, June 2019
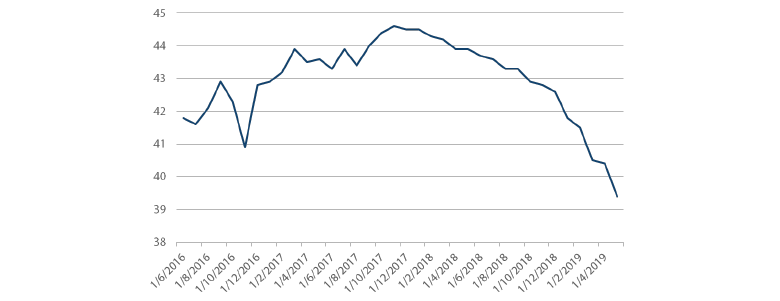
In addition to this improvement in relative yields, JGBs should also benefit from two factors in the period ahead. The first is that the Bank of Japan (BOJ) Governor Kuroda has pledged further monetary support should progress towards the BOJ’s targeted 2% inflation falter. He cited a willingness to use all of the tools available including further cuts to the policy rate and increases in asset purchases. The second factor is that Japan’s economic outlook is becoming more uncertain. As the US pursues its "America First" doctrine, global trade is declining and the risks are rising for Japan. The latest readings on retail sales and consumer confidence were weak ahead of a planned consumption tax hike in October. Granted this hike has been delayed twice before but the government seems intent on not delaying it for a third time, even to the detriment of the Japanese economy.
Chart 5: Japan consumer confidence
Source: Bloomberg, June 2019
Global credit
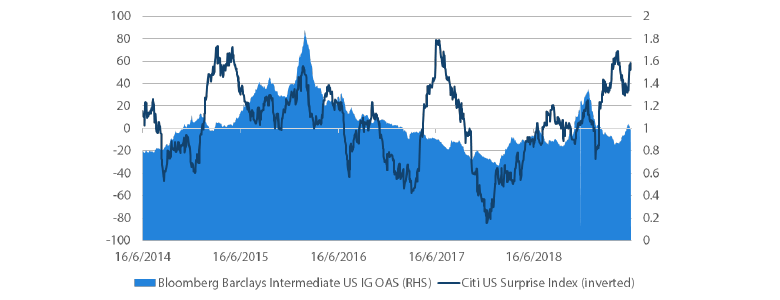
Global credit markets continue to perform well and spread levels are reasonable value. US investment grade credit spreads have recovered from the wides in January but are off the lows seen in April. While the US economy continues to be supportive of corporate credit quality, a few warning signs are starting to appear. Chart 6 shows a steady deterioration in Citi’s US economic surprise index (shown inverted such that a positive reading denotes negative surprises) in 2019 from strong levels to start the year.
Chart 6: US IG option adjusted spreads (OAS)
Source: Bloomberg, Citi, June 2019
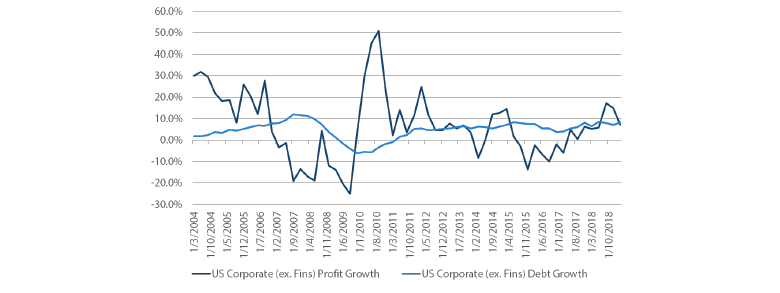
These increasingly disappointing economic data releases also appear to be reflected in weaker profit growth for US companies. Recently released data from the US Fed’s financial accounts, combined with the first quarter national accounts, provide an update on profit growth versus debt growth for US corporates (excluding Financials). Although profit growth is still positive and has only just moved below debt growth, successive periods where debt is growing faster than profits eventually lead to weaker corporate balance sheets and a deterioration in credit quality. This was evident in early 2016 where weaker profit growth was accompanied by wider credit spreads. While this is perhaps not a story for the near future, we are watching these trends closely for any further weakening of profit growth.
Chart 7: US corporate profit growth versus debt growth
Source: Bloomberg, June 2019
FX
USD rose to the top of the hierarchy, while CNY dropped below both USD and JPY given the sudden shift in sentiment (and therefore capital flows) due to the “on again” trade war. With existing tariffs lifted from 10 to 25% and possibly being applied to the rest of China exports, supply chains will indeed need to be reconfigured at the expense of China exports and investment.
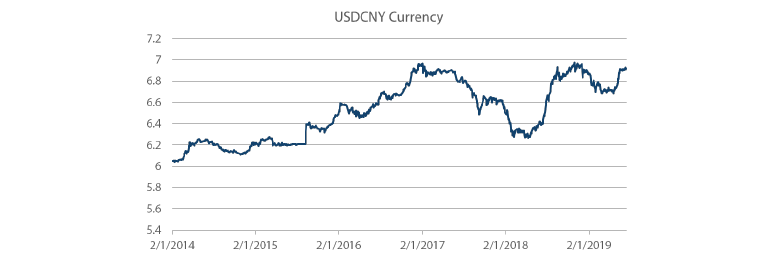
Not surprisingly, the CNY has adjusted to this dimmer outlook, and 7 CNY per dollar has been the line in the sand that the PBOC has held since it was first tested back in 2016, but it is possible that if local conditions worsen, the currency might be allowed to depreciate above 7. Nevertheless, such a depreciation would be controlled to avert any significant outflows.
Chart 8: China currency reaching 7 against the USD
Source: Bloomberg, June 2019
Commodities
We lifted agriculture above energy and industrial metals. While agriculture faced major headwinds last year as trade tensions escalated and China targeted agricultural products imported from the US in retaliation to US-imposed tariffs, fundamentals are now supportive of agriculture prices.
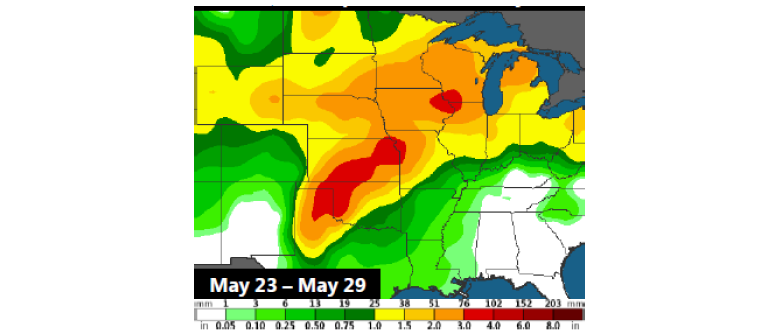
Record rainfall in the US has caused unprecedented planting delays, especially for corn. In Illinois, which typically accounts for 16% of total corn crops in a normal year, only 24% of the crop has been planted as of 20 May, compared to the 5-year average of 90%.
Chart 9: Heavy rainfall across western Corn Belt and Plains
Source: Radiant Solutions, J.P.Morgan, May 2019
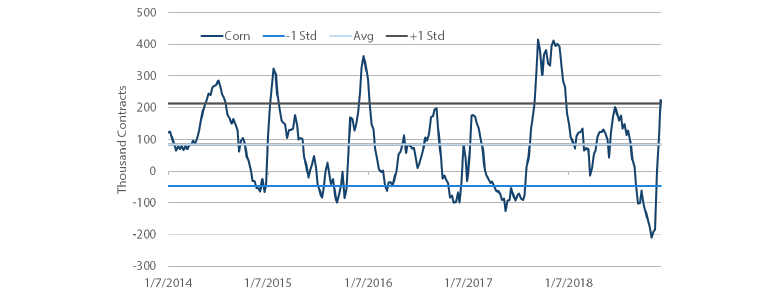
According to weather agencies, El Niño also appears to be intensifying, further hindering the global grain supply. Speculators have quickly rushed to cover their shorts across markets such as corn, as shown below. Tangible supply risks coupled with a shift in speculative sentiment could continue to lend price support despite the escalating trade war.
Chart 10: Corn speculative positions
Source: CFTC, Bloomberg, June 2019
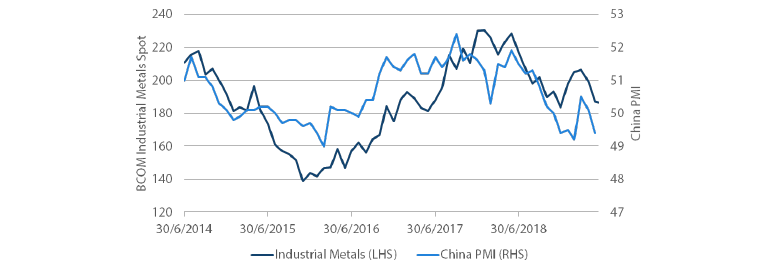
On the other hand, the renewed trade tension is weighing on sentiment for industrial metals and energy. Industrial metals are tightly linked with China’s purchasing managers’ index (PMI), as shown in chart 11 below. In May the PMI dipped into recessionary territory again, dragging down industrial metal prices. The pace and nature of China stimulus remains a key signpost, as we have noted in the past. China has so far refrained from blanket stimulus during the recent bout of weakness, instead cutting taxes to help corporates and consumers, which is less supportive of commodities. This is good for sustainability, but as the trade war escalates, China may need to activate broader measures.
Chart 11: China PMI versus industrial metals
Source: Bloomberg, June 2019
Process
In-house research to understand the key drivers of return:


