Introduction
24 hours before the Reserve Bank of Australia (RBA) handed down its decision to cut rates 25 basis points, I was questioning whether the RBA would cut in June. Today, I’m questioning how many more time will they cut this year.
There’s a first time for everything
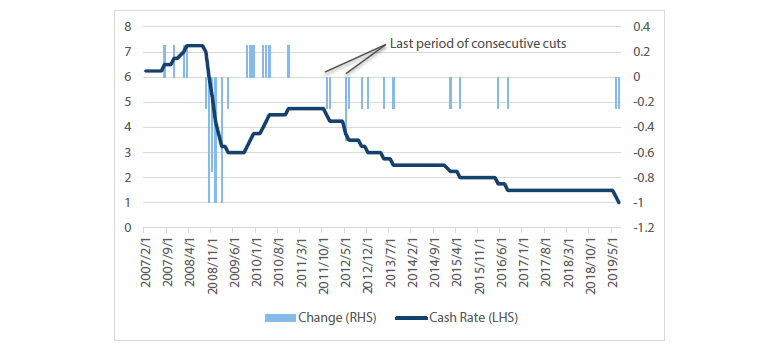
The RBA has now cut rates to an historic low of 1.0%. This is the first time the RBA has done consecutive cuts since 2011/2012. Part of the reason that I had thought they would wait (I was expecting a cut in August) is that they would follow the playbook of 2015 and 2016 — spacing out their actions around inflation releases. This was not the case.
Chart 1 RBA cash rate
Source: Bloomberg
The other reason that I thought they would delay another cut is because the economic data is really no worse than it was in 2015/2016. If we focus in on the major economic series of GDP, inflation and unemployment there are no signs yet that the RBA needs to be more aggressive than the prior periods of interest rate cuts. Across unemployment, inflation and GDP, it’s a mixed bag compared to 2016.
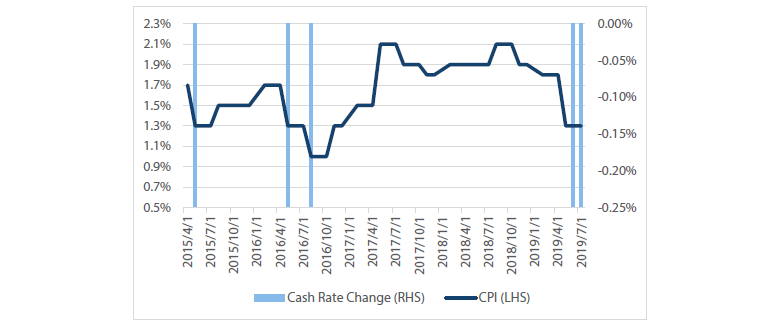
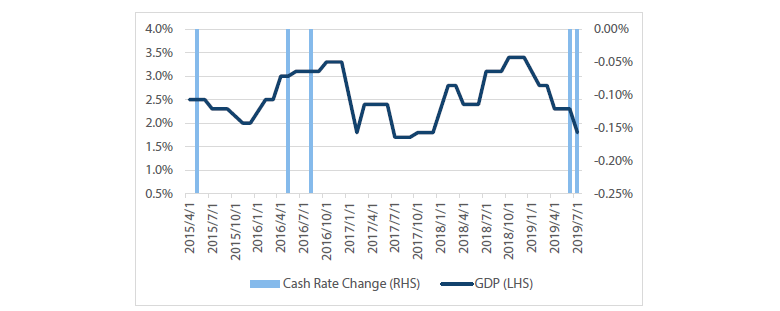
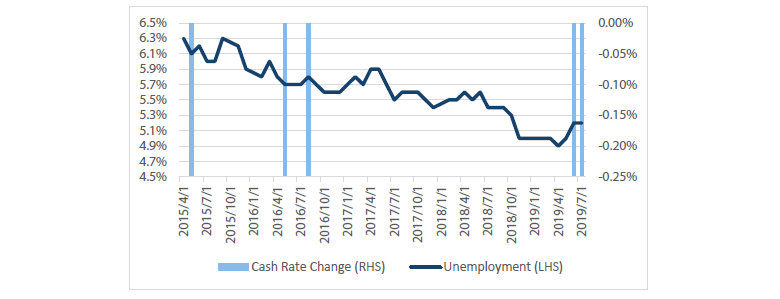
Charts 2a, 2b and 2c show data that the RBA would have seen on the day of their meeting.
- Inflation is the same level as it was in 2016 when they made the first cut.
- GDP is worse than it was in 2016.
- Unemployment is better than it was in 2016.
Chart 2a Inflation data at the time of the RBA meeting
Source: Bloomberg
Chart 2b GDP data at the time of the RBA meeting
Source: Bloomberg
Chart 2c Unemployment data at the time of the RBA meeting
Source: Bloomberg
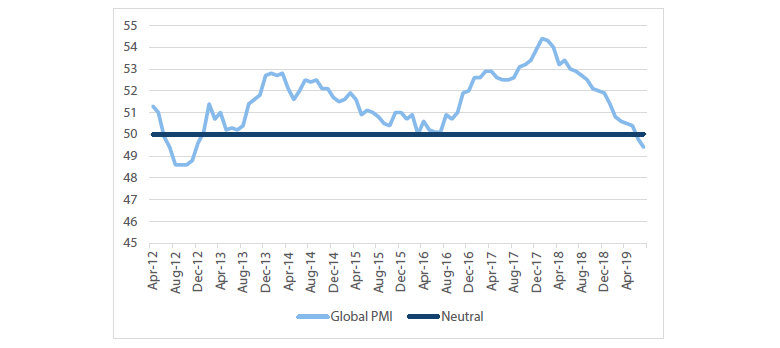
With this in mind it is also important to be aware of a major difference in the economic backdrop: that the global economy has surprised the RBA to the downside. Over the past 12 months the global manufacturing PMI has moved from a highly expansionary level to contractionary. For example, JP Morgan’s global PMI figures have fallen through 50 and are at their lowest level since 2012 (the same period when the RBA last made consecutive cuts).
Chart 3 JP Morgan global manufacturing PMI
Source: IHS Markit, JP Morgan
This leads us to the RBA’s outlook. It’s a little hard to read too much into their statement since it is only 600 words (the minutes come later this month), but there was a key inclusion in the last sentence of the statement which could suggest the RBA pauses.
Today's decision to lower the cash rate will help make further inroads into the spare capacity in the economy. It will assist with faster progress in reducing unemployment and achieve more assured progress towards the inflation target. The Board will continue to monitor developments in the labour market closely and adjust monetary policy if needed to support sustainable growth in the economy and the achievement of the inflation target over time.
Source: RESERVE BANK OF AUSTRALIA
This last paragraph of their statement was almost exactly the same as last month. The one key difference was that they added the two words that are underlined: “if needed”.
Some in the market have already started talking about this, thinking that it could mean the RBA will pause here if the economic data doesn’t deteriorate as it signals a requirement to move only if necessary. This would be in line with our previous thinking; that the RBA would go twice and then pause to survey its effects.
While I am still leaning towards this being the most likely outcome, there is increasing odds that two cuts in a row signal more urgency from the RBA then we currently see, keeping the risk skewed to more cuts rather than less.
The market reaction
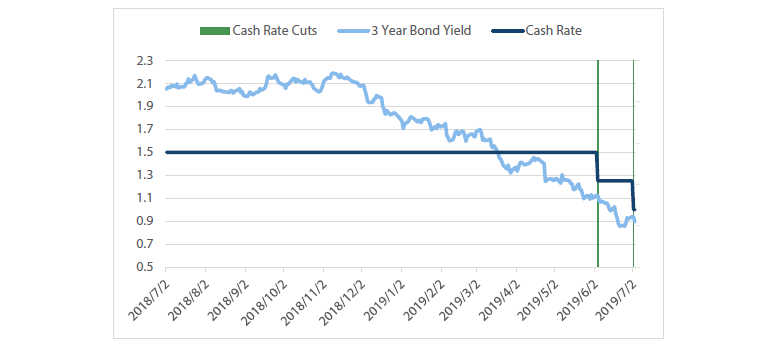
So what have bonds done? The short answer is not a lot as bond yields actually sold off slightly after the cut on July 2nd. Charts 4 shows 3-year bond yields against the cash rate, with 3-year yields sitting about five basis points off the low point of June. Given the RBA only met the market’s expectations without providing a more dovish tone, bond markets where reluctant to react.
Charts 4 3-year bond yields
Source: Bloomberg
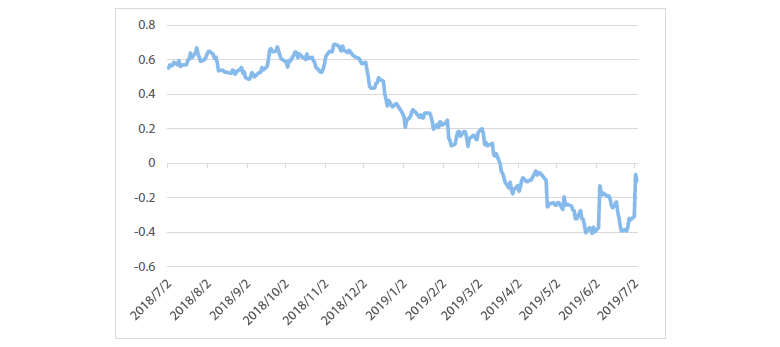
Another way to represent this is to show the spread between 3-year bonds and the cash rate. As the market expected interest rate cuts to occur, the 3-year bond yield dropped below the actual cash rate. The move higher in this spread was due to the fact that the cash rate dropped 0.25% while bond yields held stable. In order to see bonds rally further from here the market will need to expect further cuts are coming.
Chart 5 3-year bonds minus cash
Source: Bloomberg
So far I am reading the rate cut in the following way:
- While the RBA did cut, the risk/return for a long rates position is starting to move out of its favour. Bonds seem to be losing some of their momentum and the RBA has only met the market expectations, rather than exceeded them.
- We are going to need to price in further cuts to get bonds to move meaningfully lower from here, as bonds at 20 under cash already imply further moves. I personally don’t think the RBA will deliver what the market expects, as many have been talking 0.50% – 0.75% cash rates and quantitative easing (QE). The economic data does not yet warrant this, so we would likely need to see a further economic slowdown before forecasting this outcome.
- Easing out of the European Central Bank (ECB) and the Federal Reserve (Fed) could take some of the weight off the RBA. Should this improve the global outlook, the RBA may be able to adopt a slightly more positive tone. This would be in line with the performance of rates when QE ended in the US for 2015/2016 and the ECB begun their own program of QE.
Conclusion
While I might have been out by a month on the July rate cut, the move in rates highlights that a much more important question is at play: “How many more times will the RBA cut?” Because they will be coming if needed.
Important Information
This material was prepared and is issued by Nikko AM Limited ABN 99 003 376 252 AFSL No: 237563 (Nikko AM Australia). Nikko AM Australia is part of the Nikko AM Group. The information contained in this material is of a general nature only and does not constitute personal advice, nor does it constitute an offer of any financial product. It is for the use of researchers, licensed financial advisers and their authorised representatives, and does not take into account the objectives, financial situation or needs of any individual. The information in this material has been prepared from what is considered to be reliable information, but the accuracy and integrity of the information is not guaranteed. Figures, charts, opinions and other data, including statistics, in this material are current as at the date of publication, unless stated otherwise. The graphs and figures contained in this material include either past or backdated data, and make no promise of future investment returns. Past performance is not an indicator of future performance. Any economic or market forecasts are not guaranteed. Any references to particular securities or sectors are for illustrative purposes only and are as at the date of publication of this material. This is not a recommendation in relation to any named securities or sectors and no warranty or guarantee is provided.


