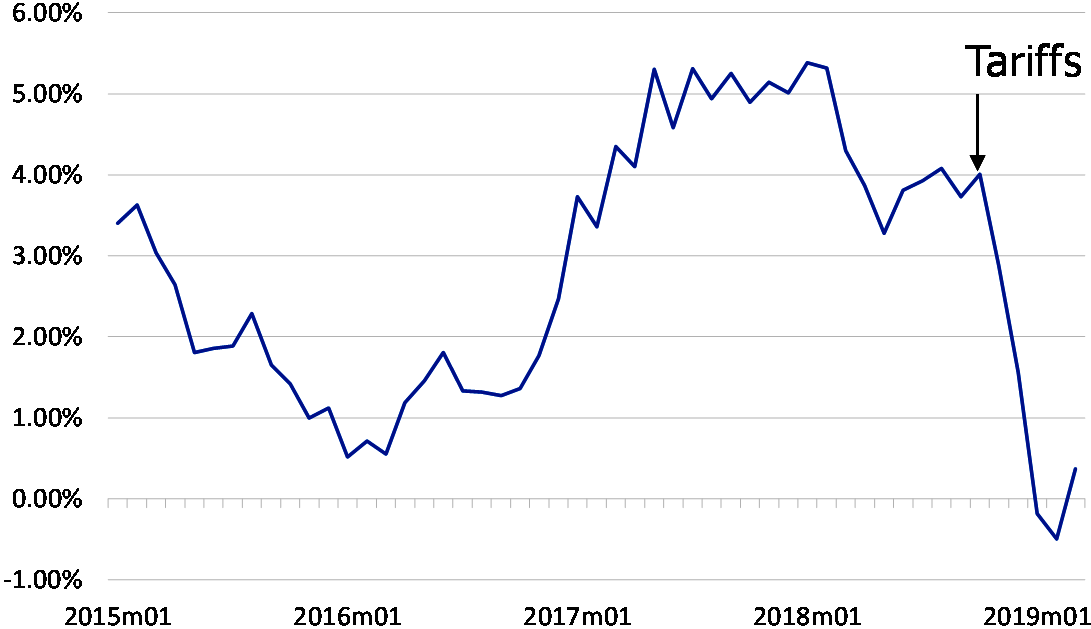
While reading through an often informative airline industry newsletter, which asserted that “although global trade was weak, global growth was robust”, we stumbled on a chart that we have reproduced below that we suspect rather neatly summarises the widely-held ‘consensus’ view on the current state of the global trade system. According to the conventionally accepted analysis, the increase in global trade friction towards the end of last summer has resulted in an immediate collapse in World Trade Growth. While we are quite prepared to believe that tariffs and the Huawei Saga exerted some degree of impact on the system, we struggle to believe that tariffs were the sole cause of the recent slump in trade - not least of all because US import growth actually accelerated in August through to October as importers attempted to front run the mooted tariffs.
CPB World Trade Volume Index % YoY, 3mma

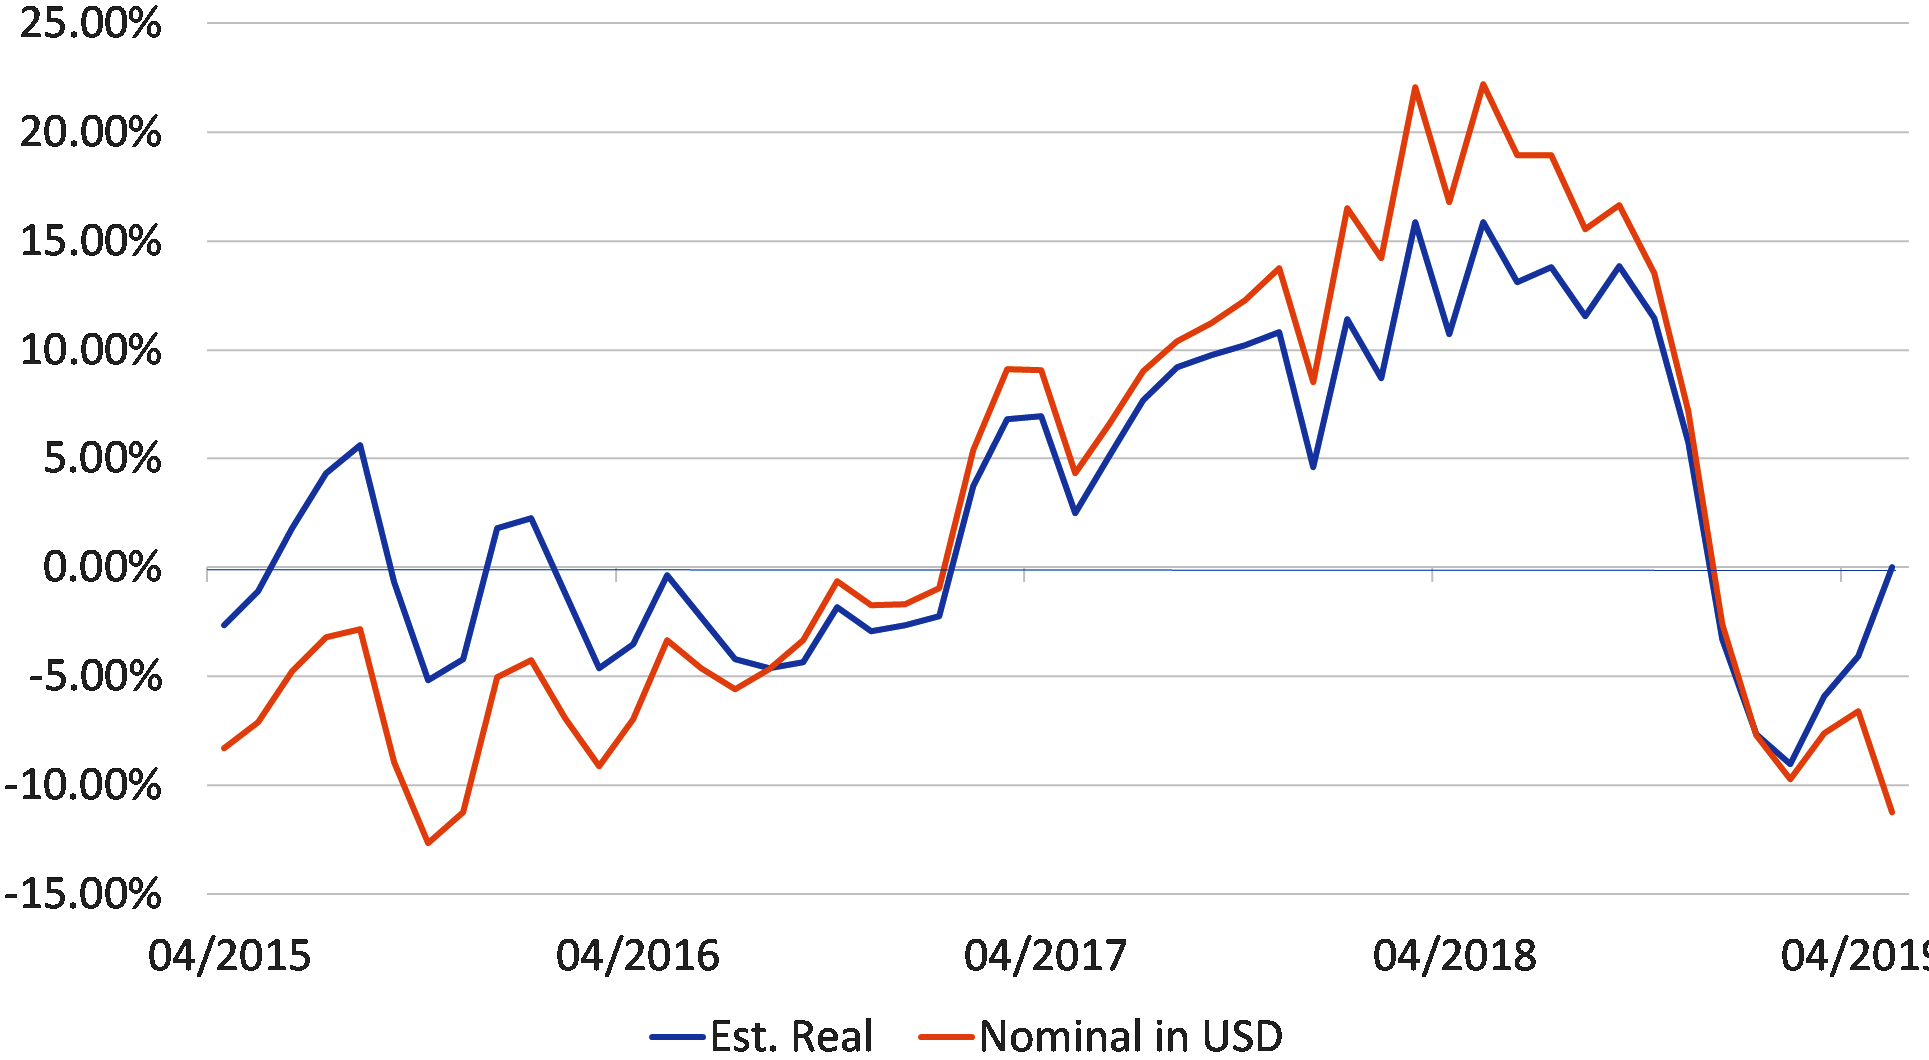
Both arithmetically and intuitively, we find a very much more plausible explanation for the collapse in world trade growth within China’s import data, which of course was not directly subject to tariffs…… We very much doubt that the almost exact correlation between the first and second charts in this report is spurious; the collapse in global trade growth in late 2018 was led not by China’s exports or by US imports trends, but by a sharp decline in China’s imports of capital goods and, to a lesser extent, China’s importation of consumer products.
China: Non Oil / Non Commodity Imports % YoY, 3mma

The sudden decline in trade volumes rivals that what was experienced during the GFC and we are surprised that it has not attracted more commentary in the mainstream media – there seems to be a feeling that one “should simply blame Trump”.
However, it should be recognized that step-like declines in economic variables are relatively rare occurrences and are usually the result of sudden and binding financial constraints being imposed on spenders (such as the collapse in global credit supply that occurred during the GFC). Moreover, we can also suggest that, despite their relative historical rarity, there was also a similar step-like shift in some of China’s internal data and in particular in the financial surplus of the combined household, corporate and local government sectors. At exactly the same time that global trade growth collapsed, there was an extremely sharp rise in the amount of ‘net saving’ occurring inside China.
Crucially, we can also observe that yet another step-like movement occurred at the same time within the fixed asset investment data within China. The series is not a particularly ‘high quality series’ and is certainly indicative rather than accurate but it too seems to confirm that there was a GFC-like drop in CAPEX in 2019Q4 within China. Indeed, we can now see that there was a GFC-like collapse in investment in China, a GFC-like increase in net saving within the economy; and a GFC-like decline in China’s import volumes. Given that each of these series are ‘independent series’ that are compiled from quite separate sources, the picture that emerges seems to be both consistent and likely robust.
It is also apparent that the bulk of the decline in fixed asset investment data occurred in local government investment within the interior of China, a variable that is unlikely to be particularly sensitive to tariffs and trade friction…. Instead, we suspect that the already established weakness in the Chinese banking system reached what amounted to a critical threshold around last September and as a result the banks were no longer able to intermediate the savings in the prosperous ‘surplus’ coastal regions into the less prosperous, more Local Government-driven provinces in the interior.
We estimate that these interior provinces possessed a net financing gap of circa 3-5% of GDP in 2017 (although it may well have been higher), which coincidently was the roughly the same magnitude as that which was experienced by the US household sector in 2005-7. Hence, when the supply of credit to the Local Government Financing Vehicles in the interior of the country dried up in late 2018Q3 / early 2018Q4, these local government were obliged to drastically – and unequivocally – reduce their level of expenditure in order to match their available financial resources. This would of course explain the ‘step functions’ in the data.
It is also apparent from the Local Government data that, in late February this year, a front-loading of property sales by local governments and some financial assistance from the Central Government resulted in a temporary easing in the budget constraint that was facing the Local Governments, who duly increased their level of expenditure in March, but since then we find that the budget constraints have re-asserted themselves as the level of property sales has fallen back and the authorities have been constrained with regard to their ability to provide any counter-cyclical policy measures by the country’s weak underlying balance of payments position.
Specifically, it is estimated that China’s banks, companies and even local governments have circa $2.5 trillion of foreign currency denominated debt, which they would presumably like to pay off quite quickly if and when the PBoC provides them with cheap RMB-funding. Since these repaymenst would place potentially intense pressure on the RMB, the central bank has not been able to ease meaningfully and hence we are not surprised that much of the economic data has either remained weak, or weakened further.
The trade journal to which we referred in our opening remarks maintained that although global trade was weak, global growth was ‘fine’. We would take issue with this statement, since we believe that the only reason that much of the global economic aggregate data series only appear look to be ‘fine’ is because their authors are using the official China output data which asserts that the economy is enjoying GDP growth of close to 7% and industrial production growth of 5% YoY.
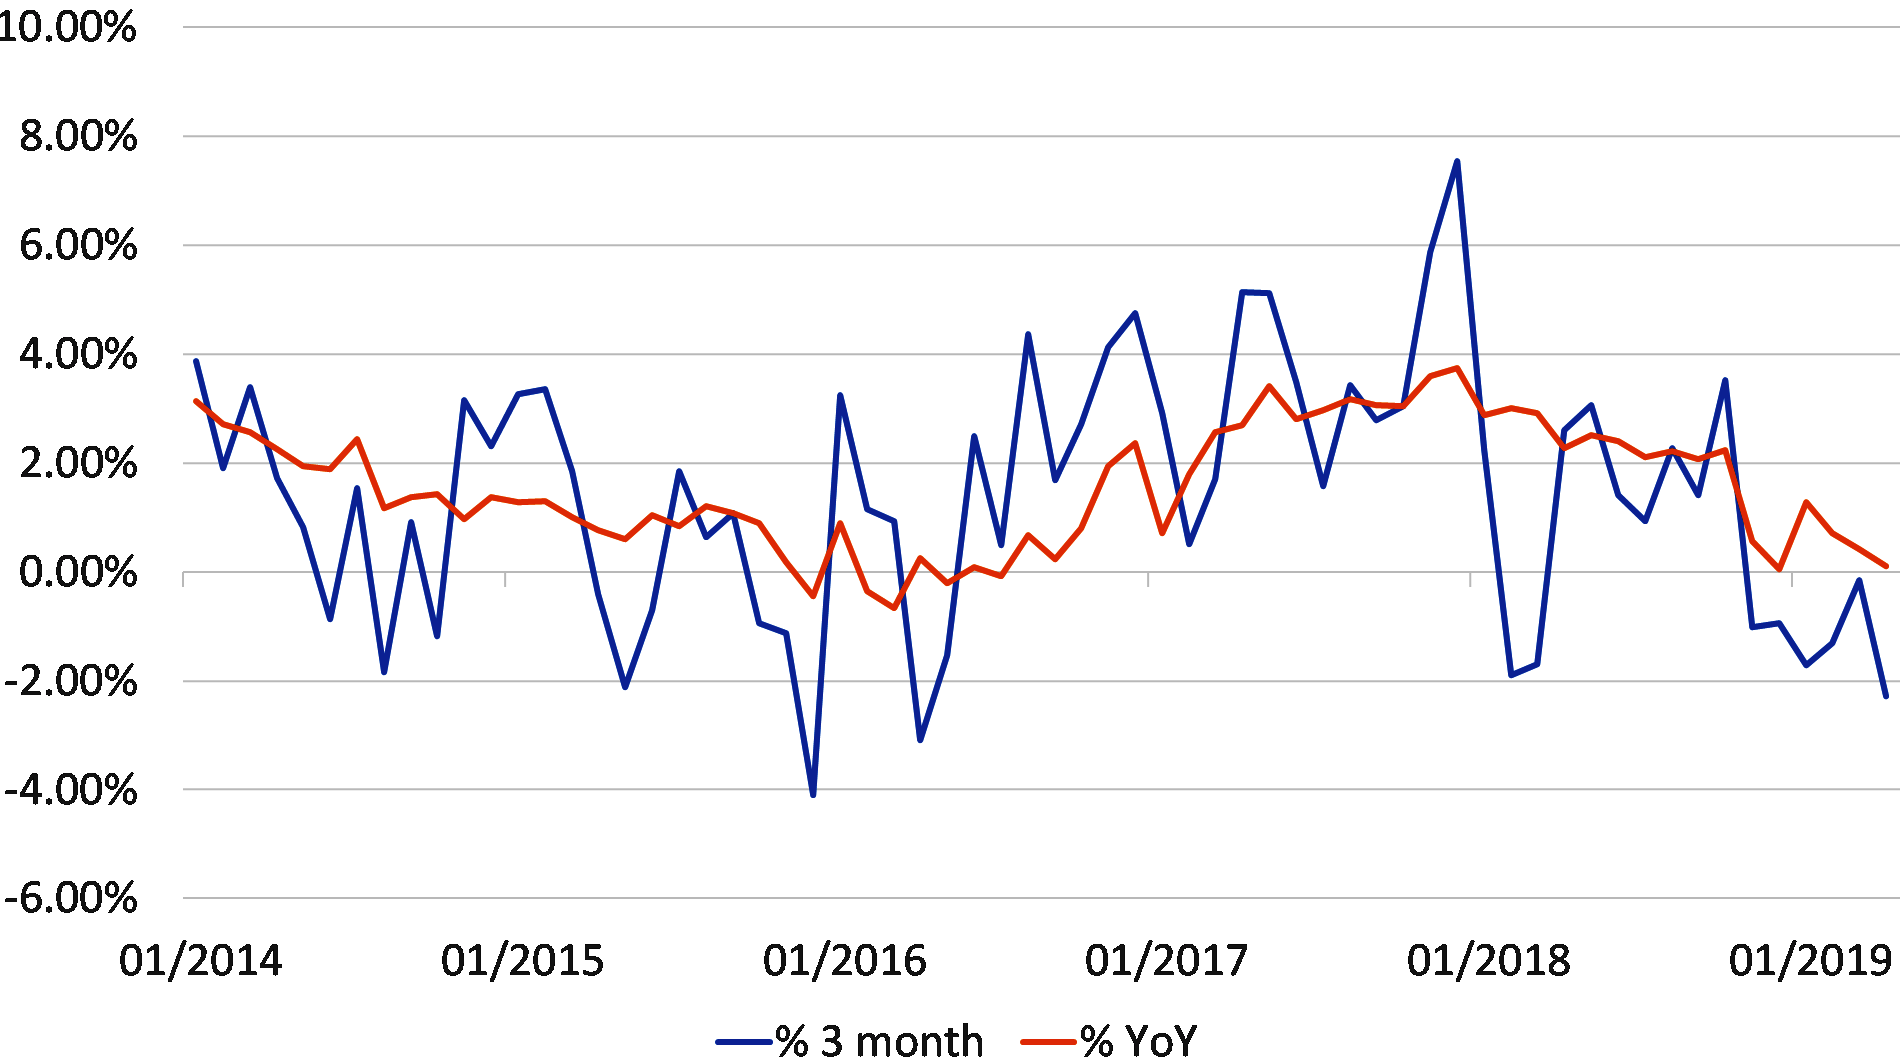
However, if we compile global indices excluding China, we find that global GDP growth is closer to 1.5% (which is generally considered to be weak / almost recession-like) and that global industrial growth is zero in year-on-year terms, or minus 2% on a three months’ annualized basis. If we were to include our own estimate of China’s underlying IP trends, then these numbers would drop to -0.7% and – 2.5% respectively. It would seem that global growth is, in fact, anything but fine.
Global IP Growth $ QoQ annualised % YoY (US, EU, JP, SK, TW)

In fact, if we consider the growth data above and the ongoing deflation that is occurring within global finished goods trade prices, we can easily imagine that global nominal GDP growth in dollar terms has dropped below 3% YoY and this would seem to provide motive enough for not only the recent move in bond markets but the signs of alarm in many policymaking circles….
Indeed, until a month or two ago, many central banks were still ‘clinging’ to the published global aggregates and espousing the ‘consensus view’ that trade was a weak as a result of tariffs, but that growth was fine. However, over recent days, they seem to have been obliged to reconsider their assumptions.
Given these events, we regard the risks to global growth to still lie firmly to the downside at this point and we can well understand why the West’s central banks have become ever more nervous – although quite what policy options are available to them is far from clear. The FOMC may yet embark on an earlier end to QT, and 2 – 3 quarter point rate cuts do indeed seem likely, while the ECB seems set to return to its “LTRO” strategies as the EZ countries turn increasingly to fiscal policies in an effort to stimulate their economies. However, even if these policies are enacted, we suspect that global growth – and corporate earnings growth – will be conspicuous by its absence for the remainder of this year.


