Snapshot
The focus for markets this year has centred around two main issues, US-China trade negotiations and the policies of the US Federal Reserve (Fed). Given that we have referenced the trade war numerous times in past months we will share some thoughts on the latter, and in particular the subject of the Fed’s independence. The place to start is to consider whether the Fed is actually a truly independent institution. And by this we think of the Fed being independent of politicians and perhaps the government more broadly.
On this score, as many will already be aware, the Fed is not a truly independent institution. Granted there are a number of features built into the system so that the Fed has some latitude to act autonomously within the government but that does not translate to reliable independence. The reason for this is that the Federal Reserve derives its authority from the Congress under the Federal Reserve Act, meaning that it is actually an arm of government. In addition, the Board of Governors, including the Chairman and Vice-Chairman, are nominated by the US President and confirmed by the Senate.
So if the Fed is not literally independent, and never has been, how does this institution maintain the illusion of independence in the eyes of markets? This question is central to how markets perceive the Fed’s actions. Under prior US administrations, the accepted convention was that the President and his administration refrained from commenting publicly on monetary policy. This had the effect of providing clear air for the Fed to conduct its regular monetary policy deliberations mostly free of any overt political interference.
However, as we’ve witnessed many times over the last few years, this US President has little regard for convention. When it comes to the Fed and its Chairman in particular, President Trump and his administration have no shortage of very public “advice” and criticism to impart. As a result of these frequent intrusions, the Fed is no longer able to maintain the illusion and has effectively lost its independence.
For many economists, including several former Fed Chairs who made their feelings known in a recent Wall Street Journal editorial, this result is a tragedy that will inhibit the Fed’s effective stewardship of monetary policy and the economy. While the longer term effects are likely negative as suggested by the experts, both risk markets and sovereign bond markets are currently benefitting from this destruction of the illusion.
The independent Fed of old would not have its every utterance evaluated in a political context, leaving market participants to guess whether this was the real Fed talking or a ventriloquist’s dummy in the President’s show. Nevertheless, the persistent pressure on the Fed to conform its message to that of the President’s is, in our view, having an effect. The President was demanding rate cuts and an end to quantitative tightening and the Fed has duly delivered. While there is no doubt that the Fed has made a case for easier policy, the validity of that case is arguable in light of a US economy that is growing above its long term trend rate.
Whether the Fed has turned towards easier policy because its unbiased analysis suggests it should or because it is unconsciously bending to President Trump’s will, is impossible to know. However, one thing we do know is that investors in both equities and bonds appear to be betting that the Fed is unlikely to regain an independent streak any time soon.
Asset Class Hierarchy (Team view1)
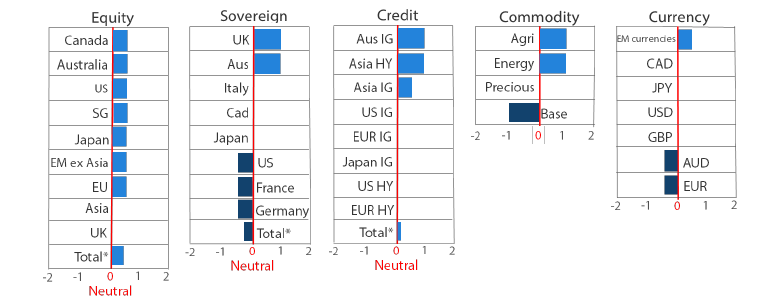
* Total scores for Equity, Sovereign and Credit are weighted average scores, which are computed using market cap weights.
1The asset classes or sectors mentioned herein are a reflection of the portfolio manager’s current view of the investment strategies taken on behalf of the portfolio managed. These comments should not be constituted as an investment research or recommendation advice. Any prediction, projection or forecast on sectors, the economy and/or the market trends is not necessarily indicative of their future state or likely performances.
Research Views
We make adjustments to our asset class views and hierarchies as discussed below.
Global equities
After Trump called the trade war back on in an early May tweet, followed by a brief truce and then more tariffs and then delaying those same tariffs, the temptation is to stay clear of China equities until the dust of uncertainty eventually clears. But obviously not all companies are affected equally, and often chaos creates value opportunities that deserve a closer look.
Given the constant trade war threats, China might have been forgiven for upscaling its stimulus effort, but the government remains fixated on stimulating private sector growth as a better outlet for sustainable, quality growth as opposed to yet another round of credit-financed infrastructure spending where productivity gains are more questionable.
Earnings recovered in 1Q19 (net profits were up 11% year-on-year) helping to support employment. 90% of job creation is from the private sector where fiscal easing has remained focused through tax cuts and incentivised bank lending. The auto sector appears to have bottomed and although retail spending is still relatively weak, ecommerce continues to take off. Revenues have seen a compounded annual growth rate (CAGR) of 41% between 2013 and 2017.
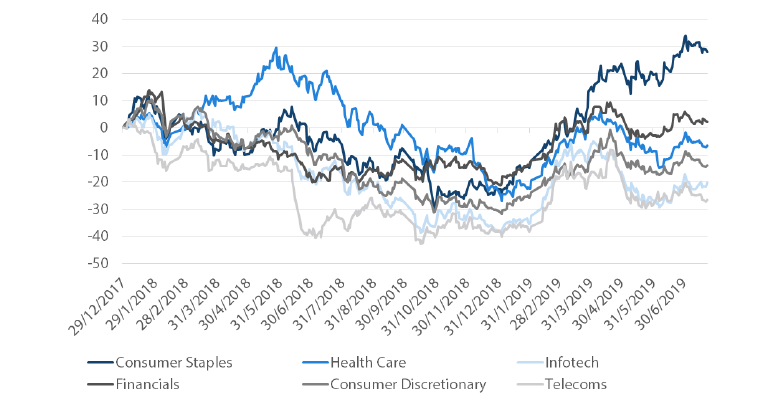
Not surprisingly, stimulus focused on the private sector and consumption has driven a divergence in equity sector performance. As shown in Chart 1, consumer stocks are up nearly 30% versus the rest of the market which is flat to down since the end of 2017.
Chart 1: China A-Share (CSI 300) sector performance
Source: Bloomberg, July 2019
China is not without significant risks as it navigates the challenges of deleveraging while keeping growth intact amid manufacturing headwinds due to trade wars, but the combination of steady policy adjustments and ongoing reforms is painting in an increasingly positive backdrop for long term sustainability.
Global bonds
It is not often that government bonds capture the attention of the broader market but that is exactly what has happened in recent months. Global bond yields have plummeted to very low levels as investors respond to an assortment of fears. While the fall in yields has been impressive, it is the level of break-even inflation rates that has caught our attention. To the uninitiated, break-even rates indicate the level of annual inflation that is required for the return on a nominal bond to equal that of an inflation linked bond (ILB) of the same maturity. We can observe this rate by comparing the real rate and the nominal rate on an ILB and a nominal government bond.
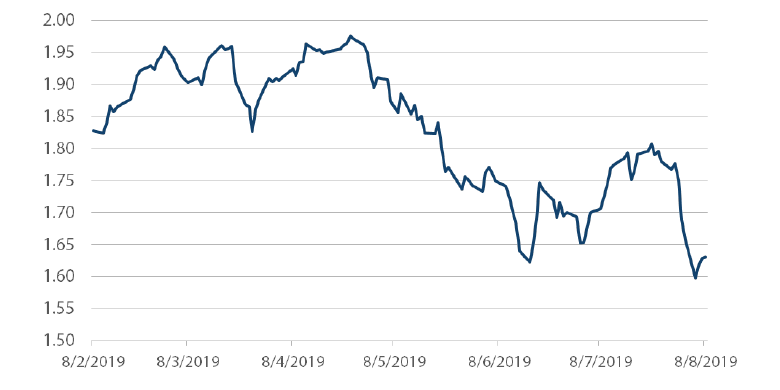
The chart below shows a sharp fall in 10-year break-even inflation in the US over the last three months, to a low of 1.6%. This suggests that investors in 10-year Treasury Inflation-Protected securities (TIPS) expect the headline consumer price index (CPI) to be as low as 1.6% per annum over the next 10 years.
Chart 2: US 10-year break-even inflation rate
Source: Bloomberg, August 2019
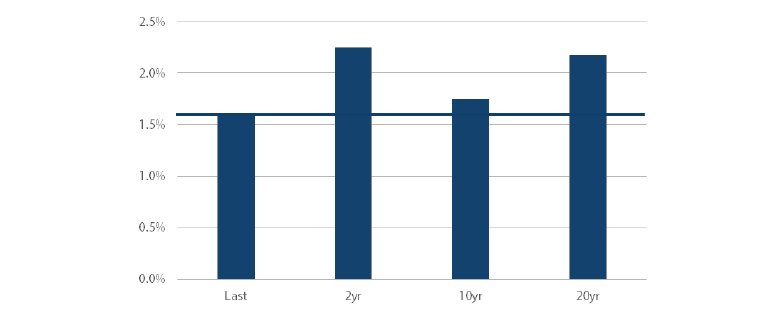
This would seem to indicate a very bearish outlook for the US economy and a healthy scepticism that the Fed will be able to prevent lower inflation. This is particularly curious in light of the US economy’s track record of generating inflation around 2% over the long term, considerably higher than the implied 1.6% inflation markets are pricing. Chart 3 shows US headline inflation over the short and long term. CPI exceeds 2% over both 2 and 20 years and exceeds the break-even rate of 1.6% over 10 years. It’s also interesting to note that both the 10- and 20-year outcomes include the deflation seen in the aftermath of the global financial crisis but still managed to exceed 1.6% (as indicated by the solid line).
Chart 3: US consumer price index (CPI)
Source: Bloomberg, June 2019
While US inflation history suggests future inflation can exceed current break-even rates, an increasingly isolationist US policy also has the potential to hinder companies from accessing the lowest cost producers in order to keep consumer prices subdued. At these low break-even rates, inflation protected securities are beginning to look attractive versus US Treasuries.
Global credit
Global investment grade (IG) credit spreads contracted in July, continuing the recovery from wider levels reached alongside the global equities selloff in May. Predictably, spreads have widened again in August, as markets reacted negatively to the US announcement of additional tariffs on Chinese exports, but stopped short of the previous levels. At these wider spreads, IG corporate bonds continue to be attractive relative to government bonds.
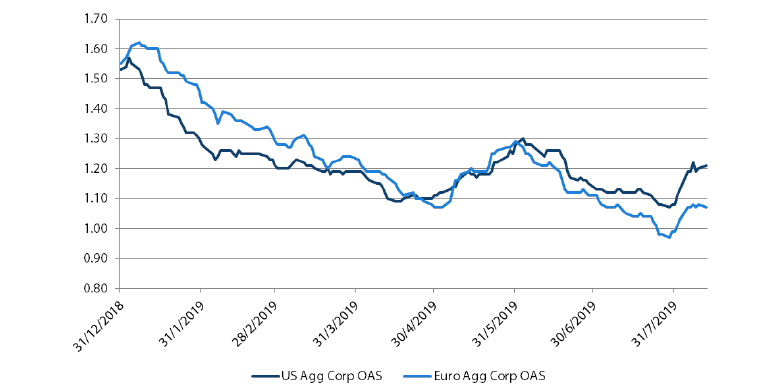
As credit investors weigh the competing influences of the US-China trade war and easier monetary policies, it would appear that central banks are winning. Chart 4 shows the option adjusted spreads (OAS) for US and European IG in 2019. European spreads have outperformed, starting at wider levels than the US and contracting through the year to levels now below the US. This has occurred in spite of weaker performance from European equity markets and a weaker economic backdrop in Europe relative to the US. The driving force for European IG outperformance has been the market’s expectation that the European Central Bank (ECB) would provide additional monetary policy support, expectations that were largely confirmed in recent ECB communications. President Draghi has gone to great lengths to convince markets that the ECB has the tools to continue to support the economy, including additional asset purchases which in the past have included corporate bonds.
Chart 4: Investment grade credit spreads (versus government)
Source: Bloomberg, August 2019
FX
Once again, currencies are facing a volatile backdrop as the world order seems to change every couple of weeks, whether it be a Trump tweet or the Fed vacillating between dovish obedience to Trump and periodic moments of sounding hawkish, perhaps to claw back notions of its theoretical independence.
In late July, the Fed’s precautionary rate cut – not the beginning of an easing cycle – clearly disappointed markets. When this was quickly followed by yet another Trump tariff announcement, the USD and JPY were unsurprisingly lifted in a classic “risk off” fashion.
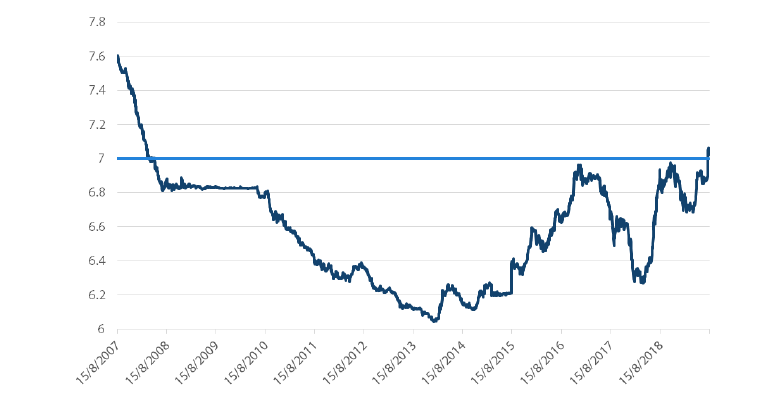
This time, China let the CNY weaken past 7 against the USD, a level seen by markets to be the line in the sand that authorities would not let cross even though authorities repeatedly stated that there was no such line. Trump reacted quickly, calling it “currency manipulation”, and US Treasury Secretary Mnuchin dutifully followed by making the accusation official.
Chart 5: China currency (CNY) breaking through ‘7’ for the first time since 2007
Source: Bloomberg, August 2019
There are four ameliorating elements to this otherwise dire sounding sequence:
- Trump chose to start tariffs at 10% on September 1st, a much more palatable level than the original threat of 25% -- one that can likely be absorbed without serious economic impact.
- Mnuchin’s formal charge of “currency manipulation” amounts to a slap on the wrist, likely positioned more to placate the boss than to inflict real damage.
- The People’s Bank of China let the CNY break 7, perhaps as a warning shot to Trump, but it quickly stabilised the currency which is much more consistent with its paramount need to maintain a stable balance of payments.
- Trump has already pushed the start date of new tariffs from September to December, trying to feed hope to the markets that negotiations can get back on track.
The sum total of these developments is far from positive, but it is also not abjectly negative. A trade deal is less likely, but both sides seem to be reaching the limits of pain they are willing to inflict, which is positive for the global economy where central banks around the world are beginning to ease. For the moment, the risk-off moves in USD and JPY seem more a reflection of short-term gyrations than a long-term trend.
Commodities
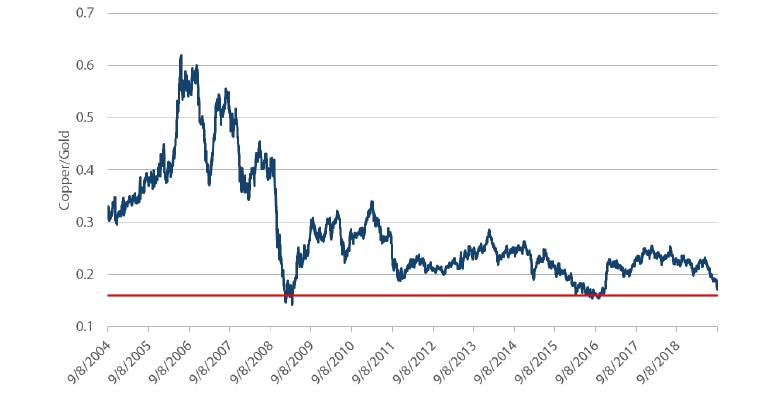
Another tweet, another storm across the commodity complex. Divergences are reaching extremes, as gold jumped while energy and base metals were hit hard. The copper to gold ratio, a growth indicator, is racing towards the bottom, last seen in the global financial crisis and the 2015 growth scare, as seen in chart 6.
Chart 6: Copper versus gold
Source: Bloomberg, August 2019
While a higher risk premium is warranted, markets have likely overreacted to the impact on global demand as described in the FX section. Rate cuts are spreading around the world and while China remains measured in its fiscal response to slowing growth, there is flexibility to do more should it be required.
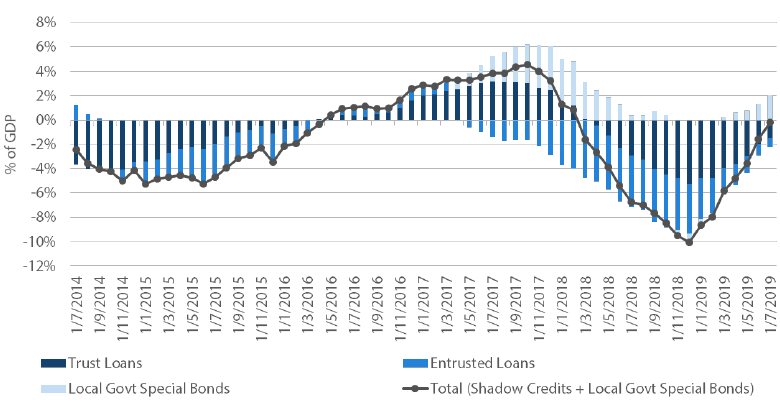
Notably, the word “deleveraging” was removed from the statement following the July Politburo meeting, so additional stimulus may not be far off. Even without additional stimulus, the China credit impulse continues to improve; it has lately been boosted further by a special bond issuance to finance local government investment in infrastructure, as shown in chart 7.
Chart 7: China credit impulse
Source: Bloomberg, August 2019
Taken together, while short-term risk aversion can continue to weigh on commodity prices, the demand stimulus and supply adjustments by OPEC should lend support to commodities over the medium term. On the other hand, crashing bond yields coupled with rising geopolitical risks will likely remain tailwinds for gold.
Process
