Introduction
Over the past 20 years fixed income funds have paid consistently higher distributions than the income available on term deposits, reflecting the fact that the yield curve is positive sloping (paying higher returns for those willing to take longer dated risk) and cash rates have been falling.
Historical distribution versus term deposits
Like term deposits fixed income funds generally pay regular income to investors, in the form of distributions. Distributions are payments made by the fund to investors. In the Nikko AM Australian Bond Fund (Fund) this is typically made up of quarterly payments to distribute the net income generated by the Fund and an annual distribution of the realised net capital gains.
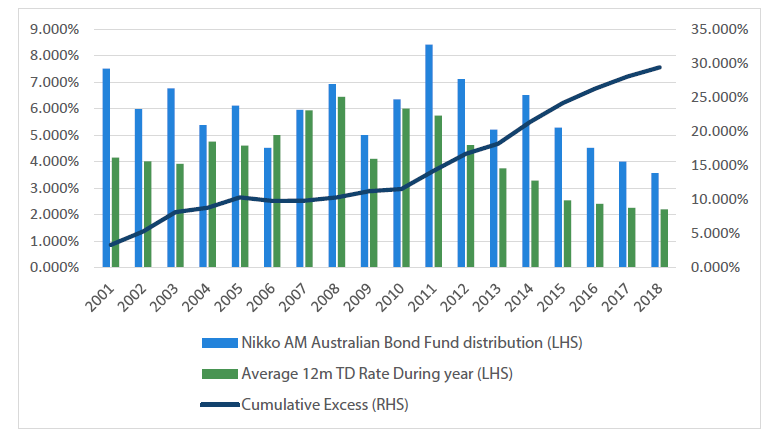
The below chart shows the distribution paid from the Fund compared to the average one-year term deposit rate over each calendar year. In all but one period since 2001, distributions from the Fund have been larger than the average one-year term deposit. In an interest rate environment where yields stay lower for longer, we would expect this outperformance to continue.
Chart 1 Fund distribution return (net) vs average one-year term deposit
Source: Bloomberg, Nikko AM, Reserve Bank of Australia. Fund growth return is the change in redemption prices over the period. Fund distribution return equals Total Fund Return minus Fund growth return. Total Fund returns are post fees, pre tax using redemption prices and assume reinvestment of distributions. Past performance is not an indicator of future performance. As at June 2019.
Looking through capital gains and losses
Investors using fixed income quite often become focused on capital gains and losses, concerned with the fact that if interest rates rise their investment will incur capital losses because bond prices fall. While this is a valid concern we believe this is too focused on the short-term effect of returns.
The predominant driver of returns for fixed income is income. As Table 1 shows, over long periods of time the capital gains/losses (referred to as the growth return) have been negligible as the total return has been dominated by the distributions.
Table 1 Total Fund return (net)

Source: Nikko AM. Fund growth return is the change in redemption prices over the period. Fund distribution return equals Total Fund Return minus Fund growth return. Total Fund returns are post fees, pre tax using redemption prices and assume reinvestment of distributions. Past performance is not an indicator of future performance. As at June 2019.
This reflects the fact that when you buy a fixed rate bond and hold it to maturity you can be relatively certain of the final return that you will receive assuming no default. For example, if you paid $100 for a 3-year bond with a 2% coupon at a 2% yield, you would receive $2 in coupon each year and $100 at maturity. If interest rates were to sell off aggressively in year one, causing capital losses, over the life of the deal the investor would still receive their $2 coupon each year plus the $100 face value - leading to a return of 2% p.a. over the entire three-year period.
In fixed income this idea is referred to as ‘pull to par’, where by bonds naturally pull back to a price of 100 as they approach maturity. An investor with an investment horizon greater than one year should be far less worried about potential capital changes and more focused on what they see as an acceptable level of yield.
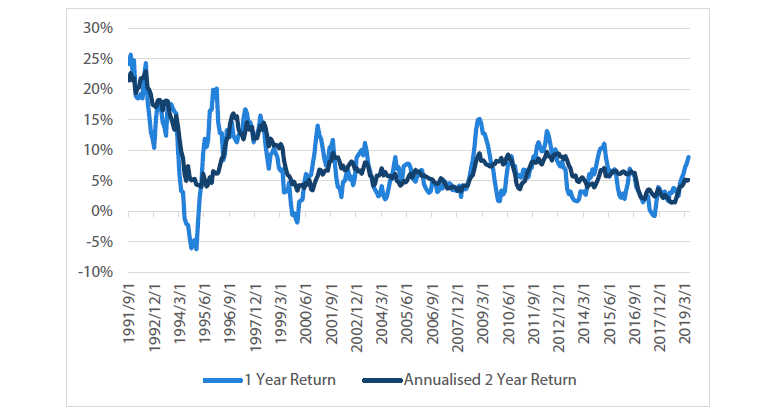
Chart 2 demonstrates this by comparing the one-year total return of fixed rate bonds with their annualised returns over a two-year period. While on a one-year basis negative returns occurred in 1994, 1999 and 2017, over any rolling two-year period there have been no negative returns since 1990.
Chart 2 AusBond composite returns
Source: Bloomberg, Nikko AM
Total return in different rate environments
The above analysis focused on the income generated from each product based on the idea that through time this will dominate returns. However, we can also look at the total one-year returns that are achieved in different interest rate environments.
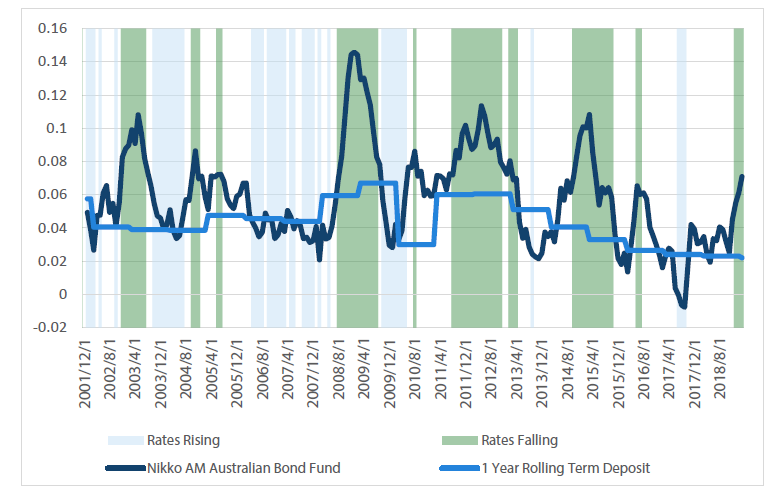
Chart 3 shows one-year performance of a rolling one-year investment in a term deposit against the net total return of the Fund. The light blue shading represents periods when 3-year bonds are rising year-over-year and the green shading shows when yields are falling.
Chart 3 Rolling one-year returns – Term deposits and Nikko AM Australian Bond Fund
Source: Bloomberg, Nikko AM, Reserve Bank of Australia. Fund growth return is the change in redemption prices over the period. Fund distribution return equals Total Fund Return minus Fund growth return. Total Fund returns are post fees, pre tax using redemption prices and assume reinvestment of distributions. Past performance is not an indicator of future performance. As at June 2019.
What Chart 3 reveals is that when interest rates have risen, fixed rate bonds have underperformed term deposits by around 1 – 3% p.a. and when interest rates have fallen (or even stablised) fixed rate bonds outperformed term deposits by anywhere from 1 – 8% p.a.
This tells us that if you can time the cycle perfectly, you can capture outperformance by rotating between cash and bonds. However, as we show below, this is an extremely hard proposition to achieve. Looking through the cycle, a long-term investor who does not believe in market timing would simply have been better off holding bonds.
A common criticism: "It's just a bull market"
The most common criticism of holding fixed income instead of term deposits is that the above analyses is simply a product of a 30-year bull market. While falling rates have improved fixed rate returns, this overlooks the fact that just because interest are low, it doesn’t mean they must rise. Looking forward, investors should understand what could occur under different interest rate environments rather than focus solely on the idea that rates must rise.
With this in mind, it is instructive to look at what occurred in the United States over the past four years because when the Australian economy is ready for the RBA to start hiking rates, we think that cash rates above 3% would be restrictive. Hence, the 2.5% increase from the Federal Reserve is similar in magnitude to what we would expect from the RBA should a hiking cycle begin.
What happened in the US? Looking back over the past four years
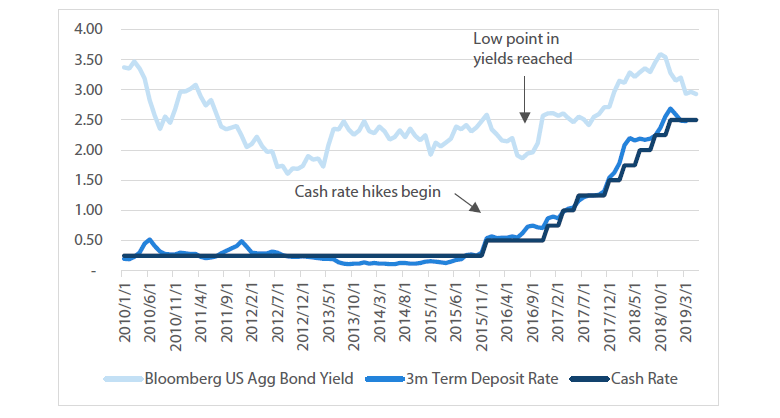
Over the past four years, the Unites States Federal Reserve (Fed) increased their cash rates nine times, taking the cash rate to 2.5%. The below analysis shows the performance of the Bloomberg Barclays United States Aggregate Bond Index (Bloomberg Agg) against US Term Deposits over this period.
For this analysis we will focus on two time periods: one aimed at the performance over the entire hiking period and the second for an investor with perfect hindsight:
- Performance since the first Fed cash rate hike — December 2015
- Performance since the low in bond yields — June 2016
Chart 4 US bond and term deposit yields
Source: Bloomberg, Nikko AM
1. Performance since the first Fed cash rate hike — December 2015
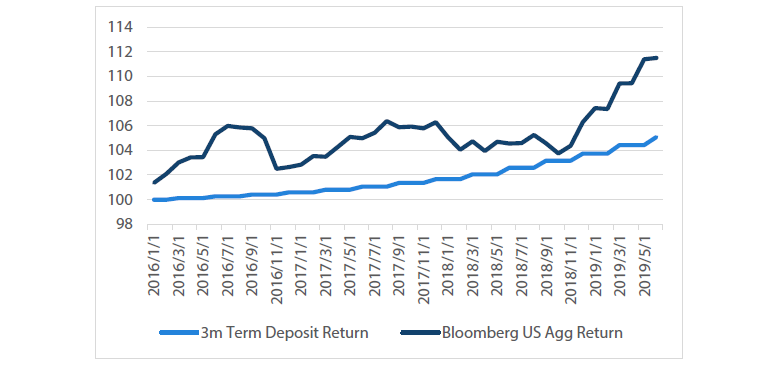
Bond yields did not immediately sell off as the Fed began hiking; in fact, fixed rate bonds initially rallied ahead of term deposits and never gave up that performance. When the Fed showed signs of pausing in December 2018, fixed rate bond yields rallied leading to the Barclays Agg posting considerable returns in excess of term deposits over the three year period. Over this time period, owning fixed rate bonds would have seen significant outperformance to term deposits.
Chart 5 Performance since December 2015
Source: Bloomberg, Nikko AM
2 Performance since the low point in yields — June 2016
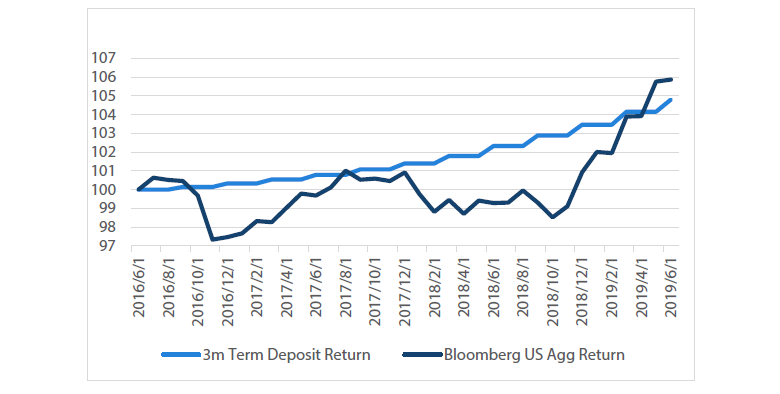
Over this time period, term deposit returns were above the Bloomberg Agg for the majority of the period, as bond yields sold off instantly causing capital losses. However, when the Fed showed signs of pausing in December 2018, fixed rate bonds went on a strong run which saw the entire differential close within six months, leaving the Bloomberg Agg ahead. While term deposits were ahead for a considerable time, this gap rapidly closed once the cash rate stopped rising.
Chart 6 Performance since June 2016
Source: Bloomberg, Nikko AM
While in both cases fixed rate bonds saw capital losses at certain points throughout the period, over the entire timeframe the performance of Bloomberg Agg ended up ahead of a rolling investment in 3-month term deposits. This should not be too surprising given the yield on the Bloomberg Agg index is higher than the term deposit yield for the entire period. Hence, even when the RBA is ready to begin hiking interest rates, it might not be a sure fire bet that fixed rate bonds will underperform over a longer time period, highlighting the difficulty that is involved with market timing.
The unspoken flip side: What if rates don’t rise?
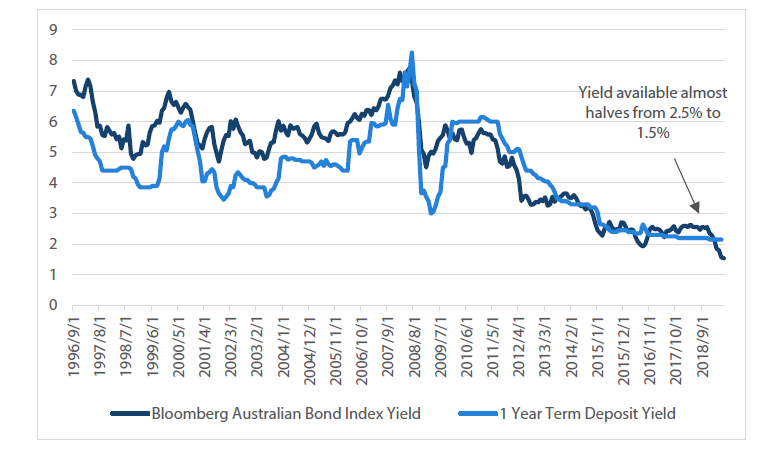
The often unspoken flip side of the rising rates argument is what happens if rates don’t rise but fall? For most of 2018 the Australian market was convinced that the RBA would hike rates, but the subsequent outcome has seen a new cutting cycle with cash rates now at 1%. As a result, bond yields have effectively halved over the past 12 months and this will see term deposit yields continue to fall.
For an investor focussed on income using term deposits, this will be a tough pill to swallow as their interest rate adjusted lower almost instantly. Those who owned fixed rate bonds last year will be able to maintain a higher yield as their bonds pay higher coupons until they reach maturity.
Chart 7 Fixed rate bond and term deposit yields
Source: Bloomberg, Nikko AM, Reserve Bank of Australia
We believe there is far too much focus on the question of what happens if rates rise, with very little willingness from investors to face the opposite question: what happens to my investments if rates fall? While we don’t want investors to overlook the effects of rising rates, we see the market almost 100% concerned about the first question without spending sufficient time thinking through the second. For investors who require income, the consequences of lower rates may be just as detrimental as rising rates, so it is worthwhile thinking about the probability of this risk.
Conclusion
Term deposits and fixed rate bonds are often thought of as similar fixed income products. Despite this, fixed rate bonds have far outperformed term deposits over the past 20 years while providing higher levels of income. While the market is constantly concerned about rising rates, the recent experience in the United States shows that for an investor with a longer term horizon this may be less of a risk than perceived.


