Snapshot
The markets have always engendered an abundance of competing narratives, but in August the divergence was particularly acute as the collapse in bond yields seemed to be calling for a global recession while equities were comparatively constructive. Our sense is that the bond markets may have interpreted the events more correctly, but a recession is far from baked in, making it all the more crucial to closely monitor signposts in the months ahead.
The month began with yet another escalation of tariffs, this time reaching the danger zone in terms of breadth and degree that will have a significant economic impact on both sides of the Pacific if fully implemented. At the same time, other geopolitical stresses seemed to be popping up all around the world, including escalating protests in Hong Kong, Boris Johnson pushing his hard Brexit agenda, a near dissolution of the Italian government, and a technical default by Argentina.
Due to the plethora of tail risks, the collapse in rates seemed reasonable, especially given the potential of one or more of these shocks to push the global economy into recession. It also made sense that bonds corrected in early September as many of these tail risks appeared to abate, helping yields to retrace at least part of their collapse. But are we out of the woods? Not likely.
Our view is a trade deal is required in relatively short order or at least that new tariffs be postponed to avoid a deeper downturn in global demand. However, the rapid escalation in tariff threats combined with increasingly harsh and even personal rhetoric seems to have brought the US and China past the point where both sides can readily get back to the table and make concessions to get a deal done.
We have become less positive on the global growth outlook mainly as a function of the prolonged trade war and increased trade tariffs that will further weigh on global demand. To date, global manufacturing has been in recession for about four months while the non-manufacturing sector is still in expansion—similar to the European crisis of 2012 and the deflationary scare of 2016.
In 2012, Mario Draghi returned confidence to the markets promising to do “whatever it takes”. In 2016, confidence returned through China’s massive reflationary stimulus. Today, the likelihood of a bold, confidence-restoring event seems more distant. While it’s true that central banks can and will ease policy around the world, there is little firepower left. Policymakers are increasingly leaning on unconventional policies such as negative rates and quantitative easing that have questionable benefits.
In our view, a boost to fiscal spending is needed to mitigate the effects of trade wars. This would likely have a more real and lasting impact than monetary easing alone. China and Europe are closer to fiscal expansion, but the US is probably not, given that Democrats would be loath to pass any spending package that helps President Donald Trump’s election prospects in 2020.
The best case scenario for risk assets would be a combination of fiscal and monetary easing, and a surprise trade deal or at least tariff postponement for an immediate boost to confidence. We do not rule out this outcome or portions of it, but we remain cautious, keeping a close watch for signs of further deterioration or any surprise to the upside.
Asset Class Hierarchy (Team view1)
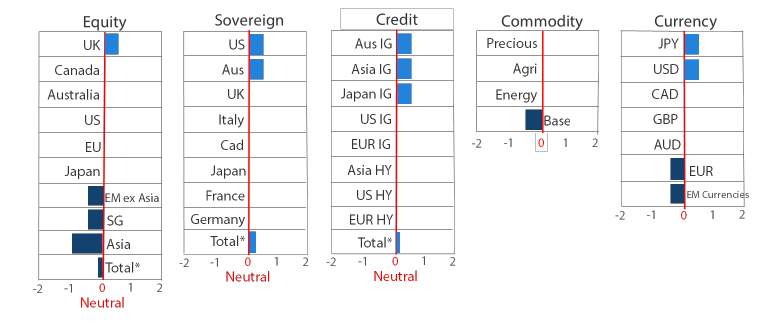
* Total scores for Equity, Sovereign and Credit are weighted average scores, which are computed using market cap weights.
1The asset classes or sectors mentioned herein are a reflection of the portfolio manager’s current view of the investment strategies taken on behalf of the portfolio managed. These comments should not be constituted as an investment research or recommendation advice. Any prediction, projection or forecast on sectors, the economy and/or the market trends is not necessarily indicative of their future state or likely performances.
Research Views
We make adjustments to our asset class views and hierarchies as discussed below.
Global equities
Equities were generally downgraded, with Asia equities and emerging markets (EM) downgraded the most on account of their deeper exposure to an escalating trade war. Importantly, after the announcement on 2 August of an increase in tariffs that President Trump had been hitherto threatening, China let the CNY break above 7 against the USD, initiating a new wave of USD strength relative to EM currencies and causing an additional headwind to economic growth.
CNY depreciation since early August has been orderly compared to the disorderly devaluation that took place back in August 2015; in the latter case, devaluation resulted in outflows that depleted the People’s Bank of China’s reserves by USD 1 trillion. Given the stability and the upscaling of stimulus that favours private enterprise, we still see select opportunities in Asia, particularly in China A-shares.
More broadly, we downgraded equities on a less promising growth outlook, but we remain cognizant of the significant repricing that has already taken place in bond markets. We believe that bonds may have more correctly interpreted the potential shock to growth, but the relative value between bonds and equities has once again reached extremes.
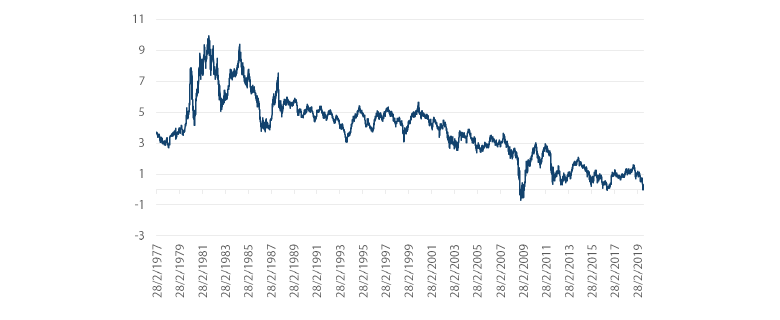
Typically, long-dated bonds will almost always yield more than stocks, but the collapse in bond yields makes this no longer the case—only the third time this has happened in the last decade. Certainly, if the US enters a recession, US Treasury (UST) excess yields could turn even more negative. But if tail risks to growth continue to abate, the relationship between stocks and bonds could revert to the mean.
Chart 1: 30-year US Treasury yields less S&P dividend yields
Source: Bloomberg, September 2019
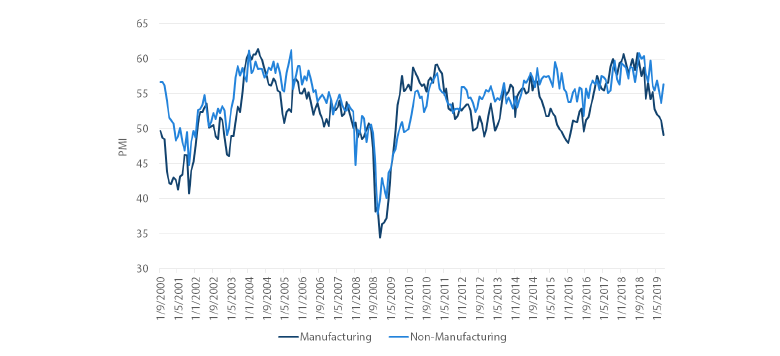
Global manufacturing has contracted the past four months, while the Institute of Supply Management (ISM) index for US manufacturing fell below 50 in August—only the third period in which this has happened since the end of the global financial crisis. The first two times were in 2012 and 2016 where stable non-manufacturing activity managed to keep the country out of recession.
Chart 2: Manufacturing versus Non-manufacturing ISM
Source: Bloomberg, August 2019
Manufacturing drives the inventory cycle, which in turn is typically driven by confidence in demand. If there is a confidence crisis, manufacturers will often decrease production to assess the impact on demand. If demand remains reasonably intact and inventories deplete, manufacturers then choose to increase production, which leads to a resurgence of growth.
Currently, inventories are being depleted, suggesting demand remains intact, but uncertainty has remained high due to the escalating trade war. A key signpost for equity markets is where manufacturing goes from here—whether new tariffs sufficiently temper demand, ultimately dragging the broader economy into recession, or whether demand holds up just enough to initiate another inventory build that will be supportive of equities.
Global bonds
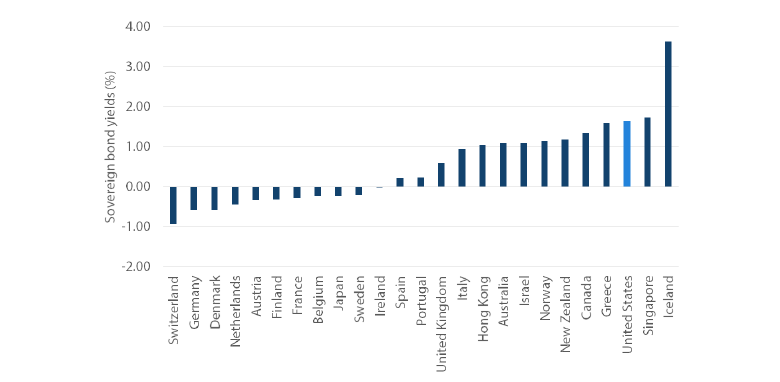
Global bond investors have enjoyed strong returns this year as solutions to a number of geopolitical concerns remain elusive. As US 10-year government bond yields offer some of the highest rates anywhere in the developed world, we have upgraded USTs to the top of our hierarchy.
Chart 3: 10-year government bond yields
Source: Bloomberg, September 2019
US bond yields have already fallen significantly but so have other bond yields around the world. It is unusual, to say the least, to have the world’s largest economy with such high relative costs of government borrowing. US bond yields are, in fact, higher than both Greece and Italy, so these are strange times indeed. While the Fed funds rate in the US is significantly higher than the benchmark rates in other countries (one obvious point of difference between the US and other countries), the notions of credit quality and capacity to repay debt have been largely pushed to the side by investors. This is an even more curious development given that much of the demand for government bonds has come from a fear of risk assets. In choosing safe haven assets to own, it seems that many investors have bypassed USTs for other, riskier government bond markets.
Looking ahead, we expect US bonds to outperform as monetary policy starts to converge to lower rates. US economic fundamentals have held up well this year, although continuing this performance is becoming more and more dependent on a strong consumer making up for a deteriorating business and global environment. As the US/China trade war escalates, a benign outcome led by US consumers looks more tenuous. The risks to US economic expansion are clearly rising and as the Federal Reserve Chairman pointed out in his Jackson Hole speech, there "are no recent precedents to guide any policy response to the current situation". While the US administration can repeat its mantra that it's winning the trade war, markets seem to indicate otherwise as safe haven flows chase UST yields lower and pressure the Federal Open Market Committee to act.
Global credit
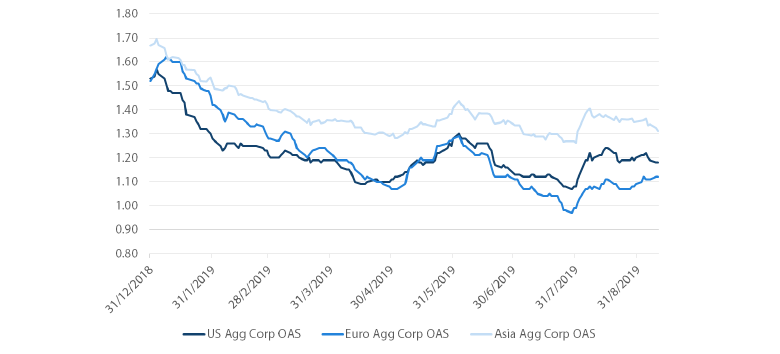
Global investment grade (IG) credit spreads converged towards US levels with Asian spreads contracting and European spreads widening. Corporate credit markets have performed very well in the face of a deluge of new corporate bond issuance. It would seem that corporate borrowers have decided en masse to take advantage of all-time low borrowing costs across all major markets. In particular for the US, new IG issuance so far in 2019 is close to exceeding the total issuance for all of 2018 with a full quarter remaining. So far, demand has been strong and IG spreads have narrowed in 2019.
Chart 4: Investment grade credit spreads (versus government)
Source: Bloomberg, September 2019
FX
Currencies turned firmly into “risk off” mode with JPY leading in momentum followed by USD. The tipping point for EM FX occurred when China let the USD/CNY break above 7 in early August. This suggested more depreciation was ahead, which indeed turned out to be the case. And the rest of EM FX followed the CNY in weakening against the USD.
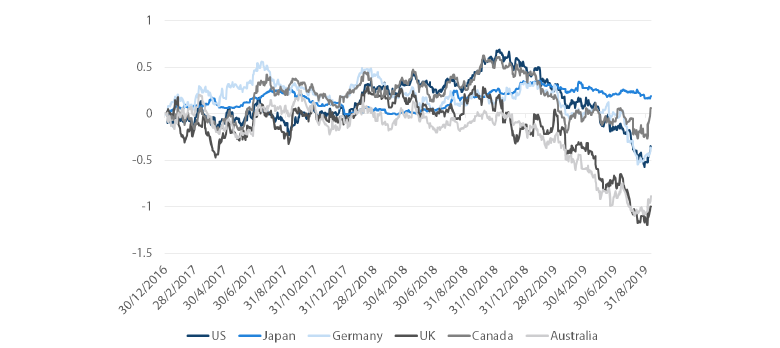
Another clear driver of the currency shift was the collapse in real yields around the world except in Japan, where real yields typically don’t budge. This is why JPY behaves similarly to gold as a safe haven asset. When real yields collapse otherwise, both gold and JPY start to look more attractive from a relative yield perspective.
Since early September, the bounce in yields is starting to reverse some of August’s trend, indicating that yields and surprises to growth will be a key signpost for currency markets in the months ahead.
Chart 5: Global real yields (%)
Source: Bloomberg, August 2019
Commodities
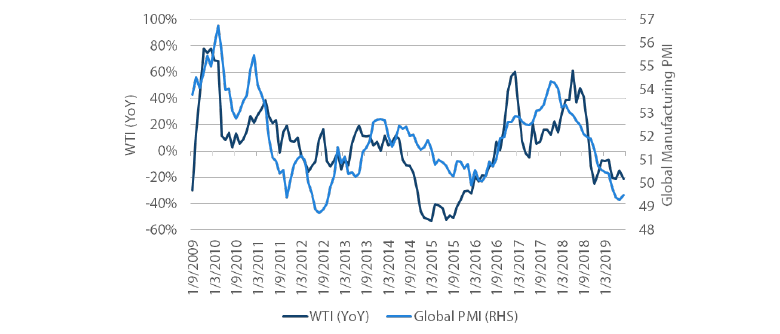
As growth prospects have deteriorated, so has the outlook for commodities, with the exception of precious metals that still benefit from increased easing by central banks and collapsing yields around the world. The decline in crude oil prices reflects the fall in demand largely driven by the contraction in global manufacturing. Over the past 12 months, crude has fallen by 21%. If demand stays weak, deeper production cuts will be required, and the replacement of the Saudi oil minister hints that such cuts may be on the horizon.
Chart 6: WTI 12-month price return versus Global Manufacturing PMI
Source: Bloomberg, Nikko AM, September 2019
Copper prices, on the other hand, are almost flat compared to a year ago, perhaps supported by hope for old-style stimulus out of China. Such hopes may be partially warranted as authorities have accelerated loans to local governments to finance new infrastructure. However, China remains focused on targeted measures to support both consumption and lending to the private sector, and is specifically not offering much support to the property market, which remains in bubble territory.
Process
