Key Points
- For European investors in Global Emerging Market Debt (EMD), Asian credit is likely an already existing part of their portfolios. However, as EMD has been volatile in recent years, we believe that a specific allocation to Asian credit can help mitigate portfolio risk.
- Given the tight spreads across global credits, particularly EMD, investors who are concerned about downside risk but still wish to retain exposure to the asset class could consider a separate allocation to Asian credit. This provides a defensive tactical allocation strategy as well as a long-term source of quality yield. Forming a separate allocation to Asian Investment Grade (IG) credit can allow investors to ‘cherry-pick’ within the liquid part of the EMD universe.
- Asian credit has displayed lower volatility compared with other high beta segments of EMD (such as those of Latin America) and European Aggregate Debt. Since 2009, Asian credit’s average annual returns have been 6.9% with a volatility level of 3.9%, giving it a Sharpe Ratio of around 1.6.
- There are structural reasons for this trend. Higher savings rates in Asia, for example, drive local capital formation, channeling flows into Asian bonds that replace hot money flows from external investors. At the same time, Asia’s higher fundamental growth rates sustain better rates of return compared to other markets with similar volatility and default rates.
Making the Most of Emerging Markets (EM)
In the last five years, EMD has performed well for investors. This in turn has attracted strong flows into the asset class, leading to a continued tightening of spreads over US Treasuries. The Corporate EM Bond Index (CEMBI) Broad and EM Bond Index Global (EMBIG), for example, were trading at spreads of approximately 281 basis points (bps)1 and 350 bps1, respectively, at the end of September 2019, compared with their highs of 532 bps and 539 bps reached in early 2016.
The EMD universe has grown significantly in recent years. It is now of sufficient size and diversity for investors to take selective positions in the asset class. As of August 2019, the CEMBI and EMBIG had a combined market size of nearly USD 1.65 trillion with 603 issuers. Asian IG credit has also become a significant segment in its own right in the EMD sphere. Within the JP Morgan Asia Credit Index (JACI), Asian IG is currently almost USD 800 billion in size.
Table 1: Asia is a Big Component of EMD
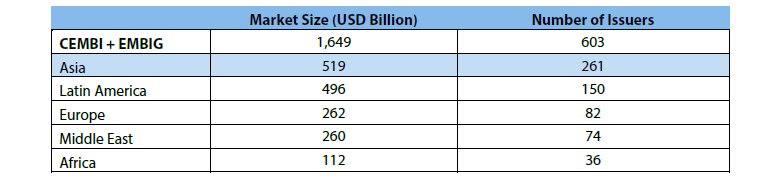
JACI has higher size than CEMBI + EMBI Global Asia given lower minimum outstanding size requirement for JACI.
Source: JP Morgan, August 2019.
There are significant differences among regional segments of EMD. Latin America and Emerging Europe—which make up 30% and 16%, respectively, of the combined CEMBI and EMBIG—have had a much higher beta over the last four years compared with Asia. Furthermore, Asian IG and High Yield (HY) credits have delivered less volatile returns relative to their US counterparts during the past four years. We believe that such phenomena are due to structural reasons.
Illustration 1: Asian Credit Generated Steadier Returns
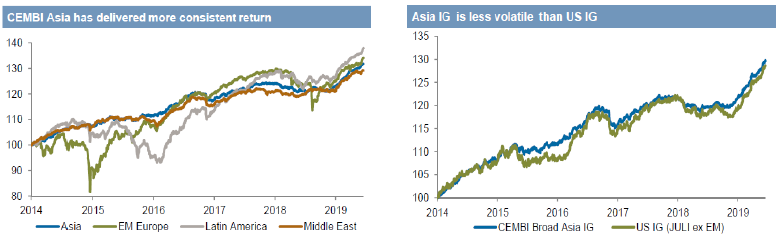
Source: JP Morgan, Asia Credit Outlook and Strategy 2H19, June 2019
Illustration 2: Rolling 5-Year Return Volatility of Different IG Credit Segments
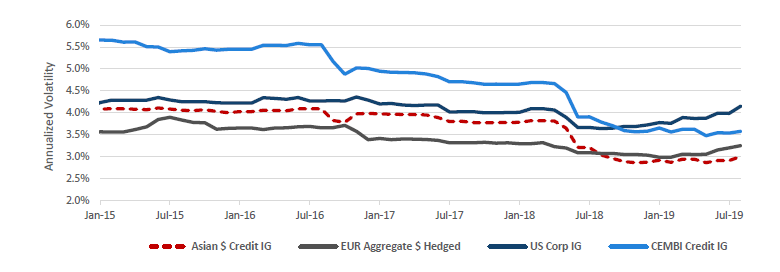
Source: JP Morgan, Bloomberg Barclays, Nikko AM, as of 30 August 2019. Volatility is based on monthly returns.
Reasons behind Asian Credit’s Low Volatility
As the charts above show, Asian Credit has been less volatile and has generated more consistent returns than those from other high-beta EM regions. In addition, it has also been less volatile relative to US and European corporate credits.
There are four key reasons why the volatility of Asian credit, IG in particular, has been so low compared with other segments of EMD:
- Fundamental Growth: Higher rates of growth and a high savings rate are key drivers.
- Technical Factors: Local capital formation and the rise of ‘local bid’; Asia owns about 80% of its own debt.
- Credit Quality: Average credit ratings for Asia are 1–3 notches above those of other EM regions.
- Credit Metrics: Net leverage of Asian IG firms has declined, whereas those of other EM regions, especially Latin America, are more stretched.
Fundamental Growth
Asia is the fastest growing region in the world (IMF forecasts growth of 6.2% for the region in 2019 vs. 4.1% for EM in total2). This not only supports the income needed to repay debt but also fuels funding required for expansion. The most prominent example is China. For China to fund its rapid economic growth of 6.6%2, it has become a key issuer of debt (both local currency and USD). At the same time, China’s high savings rate as a percentage of GDP (45%3) has also generated demand for debt by prompting local capital to seek appropriate investments.
Technical Factors
A critical difference between Asia and other EMD regions is the percentage of local ownership. Unlike Latin America (LATAM) or the Middle East, which bought 13% and 21%, respectively, of their own debt issuance last year, Asia (via its investors) purchased 74% of its own debt. That significantly helps curtail volatility in the Asian debt market.
Credit Quality
Linked to the fundamental growth story and diversification is the emergence of many new IG issuers in Asia. In 2006, only 90 issuers were able to access IG markets on the JACI, but the number has exceeded 300 in 2019. As the upgrade of Indonesia’s rating to investment grade shows, the integration of more Asian countries in global supply chains has improved their credit quality.
Credit Metrics
Relative to other EM regions, especially LATAM, the net leverage for Asian IG debt has declined since 2013 as IG companies have built up their liquidity buffers. As with Asia’s reduced reliance on external flows, the lower net leverage means that Asian IG credit is better protected against a downward correction in EMD. Net leverage in EM, including Asia, is now relatively lower compared with US IG borrowers.
The fundamental factors underpinning the expansion of Asian debt (namely economic growth, high savings rates and the high level of investment in local debt) are the key reasons for its rapid growth within the EMD universe and its low volatility in recent years. When compared with their developed market peers, we believe that Asian IG debt instruments, particularly those denominated in USD, will continue drawing support from structural factors that sustain higher levels of return and lower levels of risk.
Illustration 3: Ownership of EMD by Region
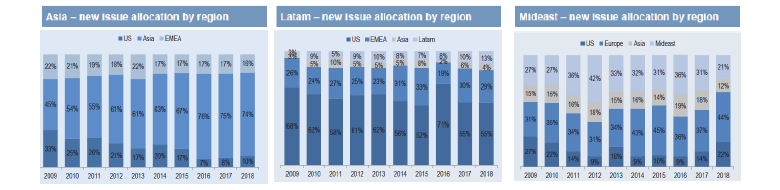
Source: JP Morgan, Emerging Markets Corporate Strategy Presentation, July 2019.
Illustration 4: EMD’s Net Leverage by Region
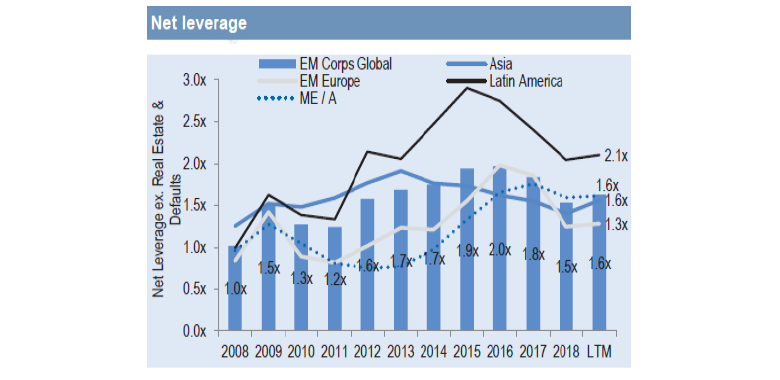
Source: JP Morgan, Emerging Markets Corporate Strategy Presentation, July 2019.
Illustration 5: EM Debt vs. US IG Net Leverage Comparison
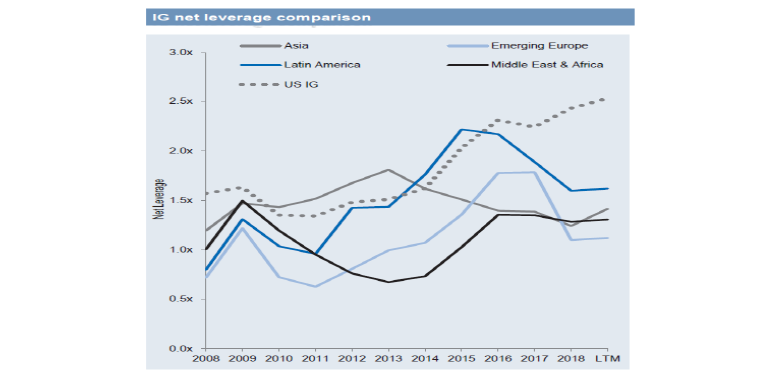
Source: JP Morgan, Emerging Markets Corporate Strategy Presentation, July 2019.
What is the Trade-Off for European Investors?
There are clearly two main costs when re-allocating defensively from higher beta segments of EMD and taking a separate allocation to Asian IG credit:
- More Moderate Returns
JACI IG, for instance, returned 10.6%4 on a year-to-date (YTD) basis (as at end August 2019), which is below EMBIG IG’s and CEMBI IG’s respective YTD returns of 16.5 %4 and 11.5%4. Furthermore, if we look at the higher beta segments of CEMBI Broad, LATAM IG produced returns of 14.8%, while EM Europe IG delivered 10.8%4 on a YTD basis. - Lower Diversification Benefits
The correlation of Asian IG credit to European corporate debt on a five-year (5Y) basis is approximately 67%. This is higher than the 5Y correlation of CEMBI LATAM IG and EM Europe IG (which measured 60% and 29%, respectively, over the same period).
However, as regional sources of demand continue to diversify, we expect the correlation between Asian credits and European debt markets to decline. Both through trade and domestic diversification, China is shifting from an export-led to a domestic consumption-driven economy, while rebalancing growth towards consumption and higher value-added growth. The growth in commercial services trade within the region, particularly in areas such as tourism, healthcare and education, should also drive diversification away from commodities and manufacturing.
Illustration 6: Rolling Correlations between JACI IG vs Euro Aggregate Index
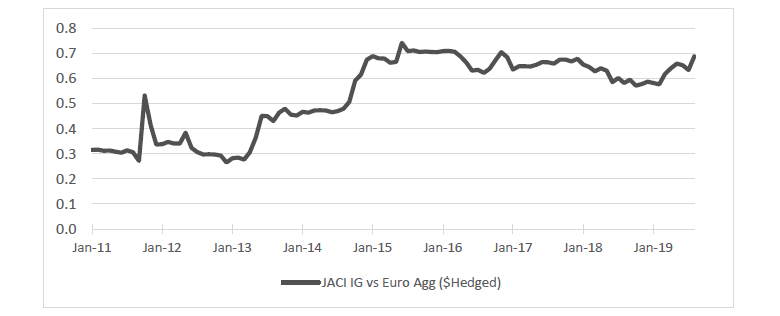
Source: Bloomberg Barclays, Nikko AM. As of 30 August 2019. Correlation of monthly returns in USD terms.
Asian Credit and Global EMD Performance
Even with moderating returns and higher correlations to European debt relative to other parts of the EMD market, the less volatile Asian IG credit tends to produce better risk-adjusted returns. The table below shows the Sharpe Ratio performance of Asian IG credit against those of the broader global EM indices from January 2009 (in the wake of the Global Financial Crisis) to August 2019.
Illustration 7: Asian IG Credit Produces a Superior Sharpe Ratio
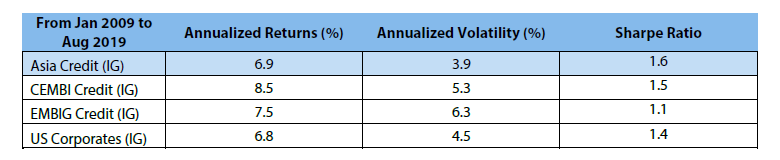
Source: JP Morgan, Bloomberg Barclays (for US Corporates IG), Nikko AM, August 2019.
Conclusions
Benefits of a Separate Allocation to Asian IG Credit within EMD
A separate allocation to Asian IG credit offers European investors a way to mitigate risk within their EMD exposure.
There is some trade-off in terms of returns and diversification against a broad EMD exposure, but it significantly reduces the downside volatility exposure associated with high-beta EMD regions.
From a long-term perspective, the fundamentals of Asian IG credit support ‘quality yield’ pick-up. We believe that there are long-term fundamentals contributing to its low volatility. Furthermore, expanded issuance in USD debt amid a continuing integration of regional economies into global supply chains will drive growth and diversification of Asian IG credit denominated in USD.
Footnotes
- 1 Source: JPMorgan, as of 25 September 2019
- 2 Source: IMF World Economic Outlook Update, as of 23 July 2019
- 3 Source: IMF World Economic Outlook Database, April 2019
- 4 Source: JPMorgan, Nikko AM calculations, August 2019