Snapshot
The performance of the US economy has undoubtedly been impressive in the period following the great financial crisis (GFC). During a decade of expansion, annual real GDP growth peaked at 4% in the second quarter of 2015 and exceeded 2% on average. Not surprisingly, this strong economic performance was a persistent tailwind for US equities. Since the end of 2009, US equities have provided a double-digit return of over 12% per annum.
In more recent times, US economic growth has remained strong even though the global economy has suffered. While the US maintains a real GDP growth rate of over 2%, other developed economies are struggling to maintain growth rates of over 1%. A more services-oriented structure which is less reliant on exports is just one of a few of the factors behind the US economy`s outperformance. US consumers are another factor as they continue to spend irrespective of the many geopolitical uncertainties, no doubt aided by the tax cuts introduced at the end of 2017.
This backdrop has certainly been supportive for markets. As a result, a popular refrain for investors in US equities has been that yes, the global economy is struggling but the US economy is doing just fine. While this has largely been true up until now, some cracks are starting to appear as the US manufacturing sector has not escaped woes gripping global manufacturing and as strength in the services economy is beginning to be questioned.
The ISM Manufacturing Purchasing Manager’s Index (PMI) has fallen precipitously since Q3 last year to a level below 50, indicating a contraction in US manufacturing. This would be concerning in itself if not for the fact that manufacturing accounts for only about 12% of the GDP. However, the much larger services sector is also starting to weaken. The ISM Non-Manufacturing PMI has also fallen over the same period to the lowest reading during the Trump presidency, although it remains above the expansion/contraction line of 50 for now. It appears that the US business sector is increasingly being subjected to the same malaise affecting the rest of the world.
So what about the US consumer, who has managed to shore up the world’s economy? It is certainly true that strong spending has compensated for weakness in other areas since the US is a consumer-driven economy after all. However, there are some concerns even in this area. While employment gains have certainly exceeded the natural increases in the supply of labour in the post-GFC period, leading to steady falls in the unemployment rate, monthly payroll gains appear to be softening as the 3-month rolling average gain has stepped down from levels over 200k in 2018 to about 150k. At the same time, the employment intentions components of both ISM surveys have pointed to further slowdowns in hiring.
Consumer confidence has been high in the US, partly as a result of the strong employment conditions, but even here we see potential signs of fatigue setting in. The most recent levels in both the Consumer Confidence Board and University of Michigan surveys are below 2018 levels. This has been a remarkable show of resilience by consumers as political risks mount on the domestic front and the US pushes to effect change to both trade and foreign policy.
Although the US economy has clearly been a beacon of strength in the last decade, history tells us that expansions do not go on forever. Accordingly, we are watching a number business and consumer health indicators for signs that this long expansion may be approaching an end.
Asset Class Hierarchy (Team view1)
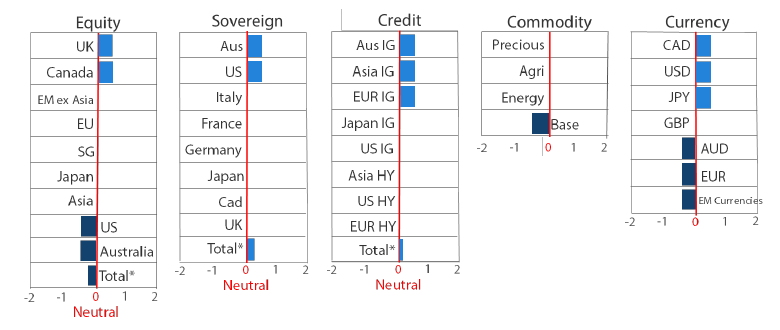
* Total scores for Equity, Sovereign and Credit are weighted average scores, which are computed using market cap weights.
1The asset classes or sectors mentioned herein are a reflection of the portfolio manager’s current view of the investment strategies taken on behalf of the portfolio managed. These comments should not be constituted as an investment research or recommendation advice. Any prediction, projection or forecast on sectors, the economy and/or the market trends is not necessarily indicative of their future state or likely performances.
Research Views
We make adjustments to our asset class views and hierarchies as discussed below.
Global equities
Global growth continues to remain under challenge, and once again equities vacillate on the hourly news flow of the trade war. Will there be a mini truce? Will tariffs be raised? We can blame the algorithms for dissecting tweets and trading news in a matter of nanoseconds, but the bottom line is that how the trade war unfolds does really matter.
The world is currently in a manufacturing recession, which the US has officially joined, so confidence is already slipping and an escalation of the trade war with new tariffs could tip the world into global recession. It is usually cyclical excesses that sow the seeds of a recession rather than policymakers, but this time might just be the exception.
In this environment, we remain cautious on equities. That said, a surprise trade deal or anything to suggest that tariffs will not be lifted or might even be reduced would be a huge win for equity markets, particularly for emerging markets that are leveraged to global growth. Despite continued uncertainty, there are still opportunities in emerging markets. We have long discussed China and opportunities in A-shares that benefit from domestic stimulus, but less-noticed opportunities include countries like Russia.
Russian assets have suffered from a long bout of uncertainty connected with sanctions and the threats of new sanctions, the last of which was implemented on 2 August 2019. But rather than implying significantly more pain, the light touch of this particular sanction signed by President Trump potentially suggests that a far harsher sanction bill moving through Congress is less likely to be passed into law.
Between looming sanction threats and tight monetary and fiscal policy at home, the Russian economy unsurprisingly slowed considerably. But with low inflation, multiple rate cuts and some fiscal easing, GDP growth is beginning to pick up again and is expected to accelerate to 2.1% by 2021. Although this is still less impressive than Asian peers, it is still a tailwind for earnings at a time when Russian equities remain quite inexpensive.
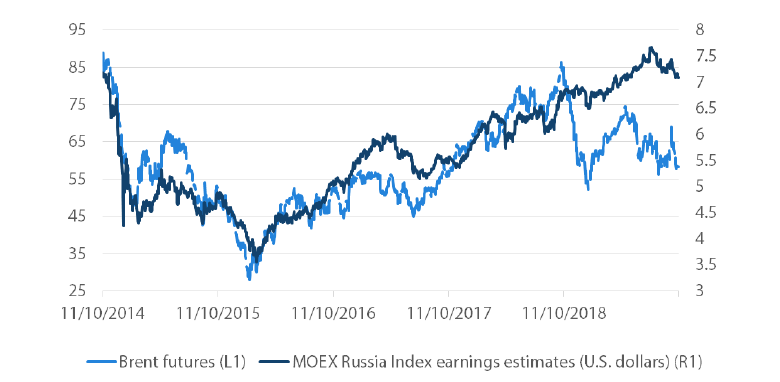
Further tailwinds are the prudent monetary and fiscal policies that have helped the country to gain twin surpluses (both current and fiscal accounts), which are the highest in the world. These twin surpluses support the currency, but prudent policies are also helping the economy and equity earnings decouple from oil prices as shown in Chart 1.
Chart 1: Russian equity earnings versus oil
Source: Bloomberg, October 2019
While we watch global growth and try to anticipate the next move in the trade war, we also seek to identify interesting opportunities, such as Russia, that are less exposed to trade wars and benefit from strong internal fundamentals.
Global bonds
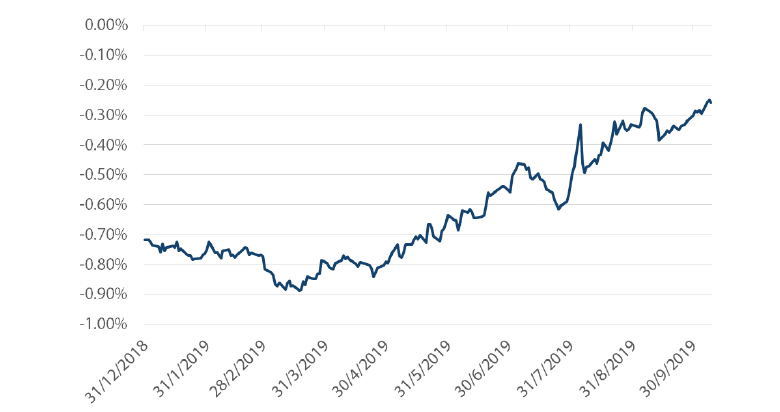
In September, global bonds in most developed markets posted their worst monthly results of 2019 US Treasury (UST) bonds led the rise in yields, climbing over 40 basis points (bps) at one stage before recouping some losses. Canadian debt posted slightly worse returns as their bonds continued to underperform US Treasuries. The yield discount on Canadian 10-year government bonds relative to USTs started the year at -70bps but was only -30bps at the end of September.
Chart 2: Canada 10-year government bond yields less US treasury yields
Source: Bloomberg, September 2019
Given the deep interdependence of the Canadian economy with its neighbor, this divergence has been notable. The main driver has likely been the respective monetary policies of the US and Canadian central banks. While the US Federal Reserve (Fed) has lowered cash rates by 50bps this year, the Bank of Canada has stood pat and markets still assign a less than 40% probability that rates will be lowered at all in 2019.
This makes the Bank of Canada one of the few central banks seemingly not on the verge of an easing cycle, which stands to reason as inflation (both headline and core) hover around the 2% target and as the economy is getting a boost from strong rebounds in housing and energy production (and higher oil prices). While we do not expect Canadian bonds to necessarily buck the falling global yield trend, the lack of central bank support makes its bonds less attractive than many of its peers.
Global credit
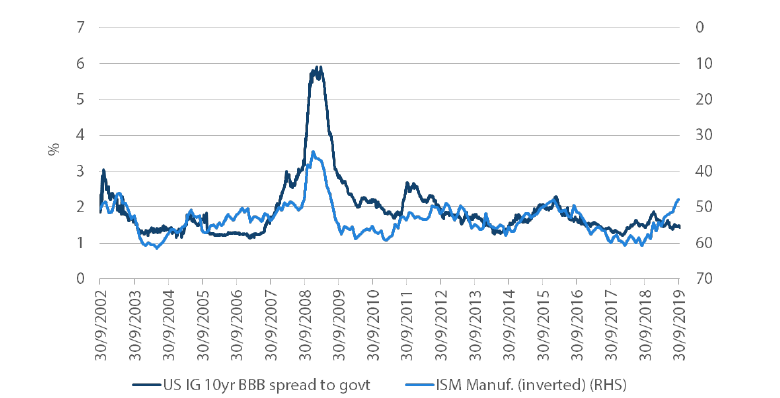
Global investment grade (IG) credit spreads have trended lower in 2019 to historically tight levels. This has occurred in a period where economic growth has been above trend in the US but weaker in Europe and Asia. While manufacturing PMIs have been foretelling slower growth outside the US for some time, recent PMI readings have been pointing to slower growth ahead for the US as well. The chart below shows a reasonably strong relationship between the ISM Manufacturing PMI in the US and credit spreads. Softer ISM readings in the past (shown as inverted in the chart) have often coincided with wider credit spreads. However, there appears to be a divergence this year as the PMI has weakened but credit spreads have continued to tighten. The combination of already low borrowing costs and additional central bank easing in the US and Europe are nevertheless likely to keep investment grade investors confident in the near term.
Chart 3: ISM Manufacturing PMI and US investment grade credit spreads (versus government)
Source: Bloomberg, September 2019
FX
As long as global growth remains under challenge and the risk of trade war escalation lingers, the USD is likely to remain strong, keeping it near the top of its peers and leaving emerging market currencies toward the bottom of the hierarchy.
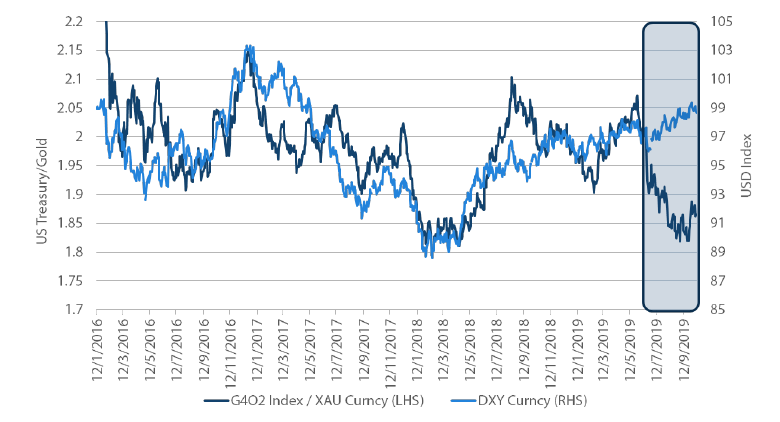
The performance of gold relative to global bonds when compared to the USD, as shown in chart 4, highlights an interesting relationship.
Generally, when bonds outperform gold, the dollar tends to strengthen and when gold outperforms, the dollar tends to weaken. Our interpretation is that this relationship is tied to monetary policy. When policy is tight, global growth weakens which compresses bond yields and lifts USD. Conversely, when central banks shift to easier policy and perhaps to quantitative easing, gold tends to outperform bonds as increased money supply and potential growth is anticipated.
Global bonds have so far had a great year with UST 10-year yields compressing about 100bps, but gold has had an even better year, gaining roughly 26%. However, the USD continues to strengthen although gold’s strength would seem to suggest that the currency should be weaker. While gold is bought for a variety of reasons, including rising geopolitical risks of which there are plenty, we think gold may also be pricing easier policies ahead.
The Fed has already shifted from quantitative tightening and is once again expanding its balance sheet. This is more about tending to financial system plumbing than outright quantitative easing, at least for the moment. But while the Fed has sounded dovish and brought down bond yields, bigger policy easing ahead may return the USD to weakness.
Chart 4: US Treasury / Gold versus USD
Source: Bloomberg, October 2019
Commodities
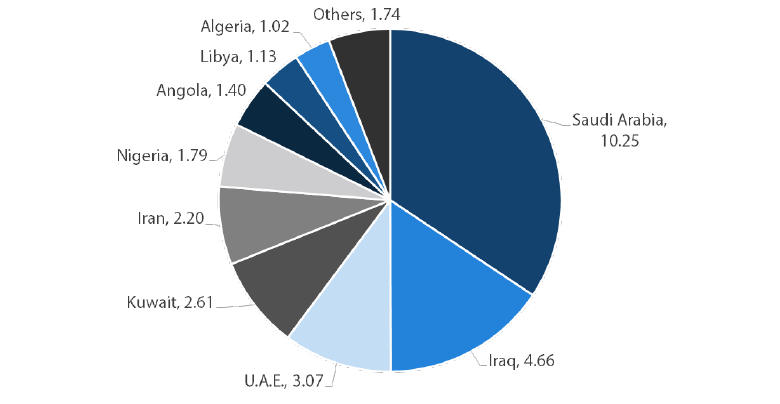
Crude oil had a roller coaster ride in September, as news broke of a drone attack on Saudi Arabia’s largest oil facility that effectively cut the country’s production capacity by half. This represented a reduction of about 5% of global total supply, or 17% of OPEC’s supply. The Saudi government responded swiftly to tap its global inventories to smooth delivery while recovering the facility in the meantime. It was reported that most production capacity had been restored by the end of September, and the Kingdom will be back to full capacity by end-November.
Chart 5: OPEC oil Production (million barrels per day)
Source: Bloomberg, Energy Intelligence Group, August 2019
While the market calmed down very quickly, we believe the risk premium should be higher after the attack. The fragility of the production facilities was exposed at a time when a peace deal between US and Iran seems unlikely. Furthermore, the US withdrawal from Syria is likely to heighten regional tensions. In our view, the higher probability of supply disruptions warrants a higher oil price to hedge risks and offset some growth concerns.
Process
