Summary
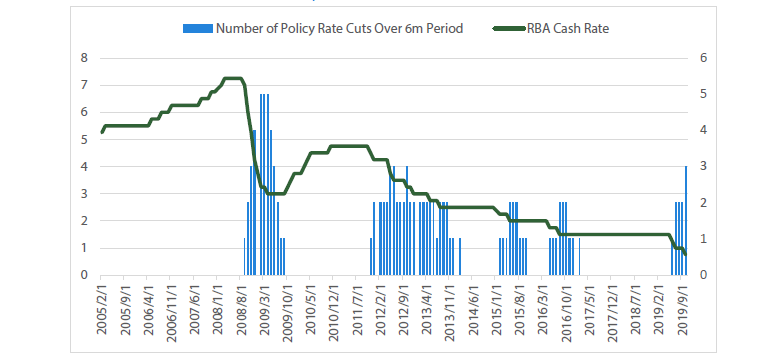
October saw the Reserve Bank of Australia (RBA) cut interest rates to 0.75%, the third cash rate cut in only five months. The last time we saw the RBA move this quickly was 2011/2012; approximately 12 months after it completed its 2010 hiking cycle in the midst of the European debt crisis.
Chart 1 Cash rate and number of cuts over 6-month period
Source: Bloomberg
In light of this shift in rates, and Phillip Lowe’s recent comment’s that it’s not the right assumption to make that the RBA “Have a lot more work to do to get inflation back to target”, it’s worthwhile looking at what the RBA is telling us and to ask the question: Just how low rates could go?
The best place to start is with the RBA’s statement on why they cut rates:
“…to support employment and income growth and to provide greater confidence that inflation will be consistent with the medium-term target. The economy still has spare capacity and lower interest rates will help make inroads into that.”
— Statement by Phillip Lowe, Governor: Monetary Policy Decision 1 October 2019
Here the RBA tells us that the reason for lowering rates was to support employment growth and bring us closer to their inflation target. Furthermore they go on to say that if this is not enough to move towards those goals, we should expect more:
“The Board will continue to monitor developments, including in the labour market, and is prepared to ease monetary policy further if needed to support sustainable growth in the economy, full employment and the achievement of the inflation target over time.”
— Statement by Phillip Lowe, Governor: Monetary Policy Decision, 1 October 2019
This is a subtle shift compared to previous statements from the RBA, as over the past three months the RBA has been consistently telling the market that monetary policy is not the only tool available to improve economic outcomes and that quantitative easing (QE) remains “unlikely”. At a cash rate of 0.75%, this would imply that either the RBA is willing to cut rates well through 0.50% to zero if inflation outcomes do not improve or QE is far more likely a policy option than the RBA had previously let on.
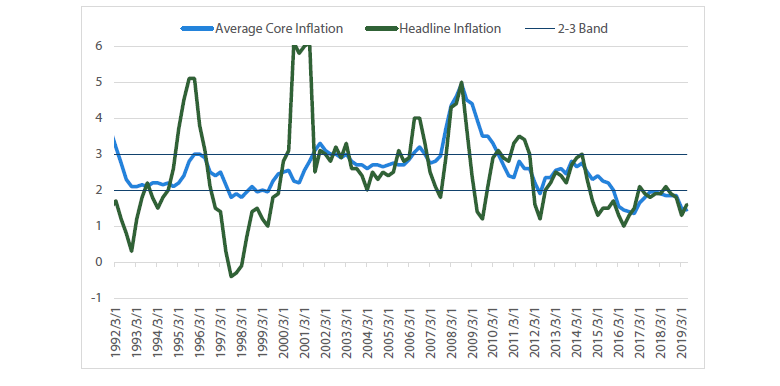
Furthermore, given the RBA has essentially missed their inflation target since 2015, it’s is interesting that they have decided to adopt this urgency now. As already mentioned, the pace of these cuts was faster than in 2015 when the inflation rate was lower than the current level (averaging 1.5%), the unemployment rate was almost a percentage point higher (averaging 6.05% for the year) and the iron ore price fell over 50%. So, what is it in the current environment that has the RBA operating at a faster pace than in both 2015 and 2016?
Chart 2 Inflation measures
Source: Bloomberg
1 Inflation – Does the rationale hold water?
The RBA’s central idea is that if they are able to get the unemployment rate low enough, wages growth will come back to life and this would spur inflation. In economics, this idea is referred to as the Phillips curve and has been the bedrock of central bank thinking over the past 30 years.
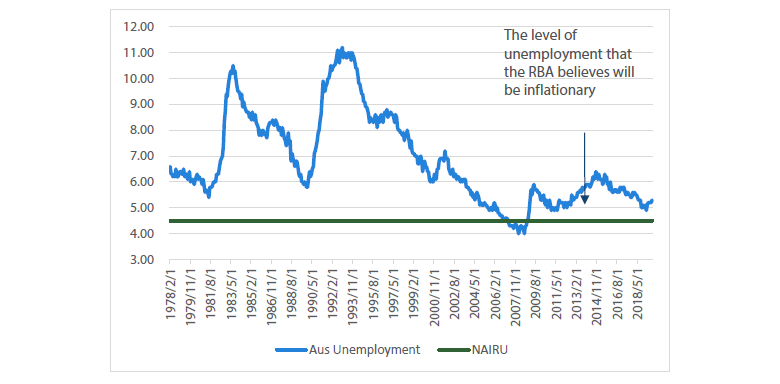
Recently, the RBA told markets that they believe that 4.5% is the level of unemployment at which wages growth will start to increase (In central bank speak this is called NAIRU – the non-accelerating inflation rate of unemployment) and lead to price pressures in the economy. This gives rise to the RBA’s view that they need to run more accommodative monetary policy, as over the past three months the unemployment rate has started drifting higher to 5.2%, implying there is still substantial “spare capacity” in the labour market.
Chart 3 Australian unemployment rate
Source: Bloomberg
From a broader perspective we should be asking whether this makes sense, as there are a number of ideas worth exploring that could challenge this notion.
1. The RBA’s 4.5% level of unemployment deemed inflationary
If we refer to Chart 3, we see that the Australian economy has been able to generate an unemployment rate below the 4.5% (NAIRU) level only once over the past 40 years, which was during a brief stint between 2006 and 2008. Historically speaking, this period was associated with financial excess, above trend growth and bubble like conditions. Whether we should be aiming monetary policy to achieve similar levels of employment, in order to generate inflation, could be questionable if it opens up future financial stability concerns.
Furthermore, at the state level both the ACT (3.5%) and NSW (4.3%) have unemployment rates below the 4.5% NAIRU rate identified by RBA, but are generating wages growth below 2.5%. This raises the question of how reliable the estimate of NAIRU actually is and whether driving unemployment down to these levels would actually create the wages growth the RBA desires.
2. NAIRU as an economic indicator
The problem with NAIRU is that it’s not an observable economic indicator but, rather, is estimated based on how wages are responding to the historic unemployment outcomes. This is described in research from the RBA:
“The NAIRU is not observable, but we can infer it from the relationship between the unemployment rate and inflation (or wage growth).”
— Estimating the NAIRU and the Unemployment Gap, Tom Cusbert, June 2017
“There is substantial uncertainty around our estimate of the NAIRU.”
— Watching the Invisibles, Luci Ellis, 12th June 2019
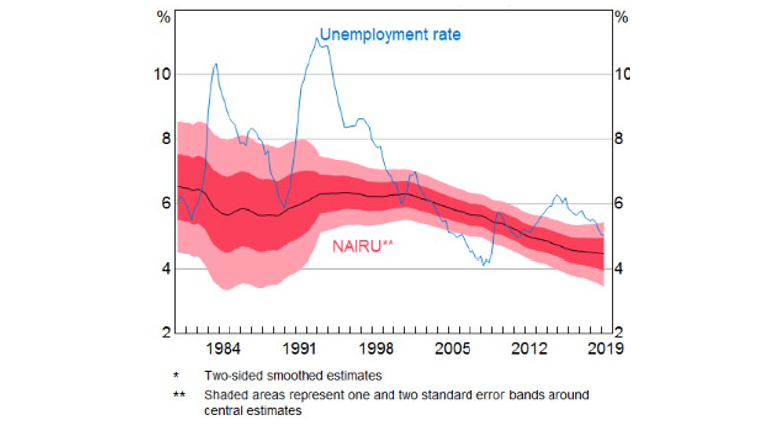
This means we will only know when we hit an inflationary point when wages start rising. If unemployment is falling and wages don’t rise, then it will stand to reason for the RBA that we must not yet have hit NAIRU and “spare capacity” remains in the employment market. This creates difficulty as the RBA is forecasting a non-observable factor that can move as employment outcomes improve. For example, Chart 4 shows that as unemployment fell over the past five years, the NAIRU estimate slowly moved lower and lower – giving rise to a shifting goal post for what the RBA deems inflationary.
Chart 4 NAIRU estimates* – per cent of labour force, quarterly
Source: ABS, RBA
The problem is that there may be other factors which also drive wages, which would mean the outright level of unemployment is not the sole driver of wage outcomes. In this environment, we could drive down unemployment to all-time lows and not see the wages growth expected. This observation hasn’t gone unnoticed by the RBA, as Lowe touched on the idea in a recent speech:
“Another possibility is that the unemployment rate, by itself, no longer provides a good guide to spare capacity, partly due to the flexibility of labour supply.”
— Inflation Targeting and Economic Welfare, Phillip Lowe, 25th July 2019
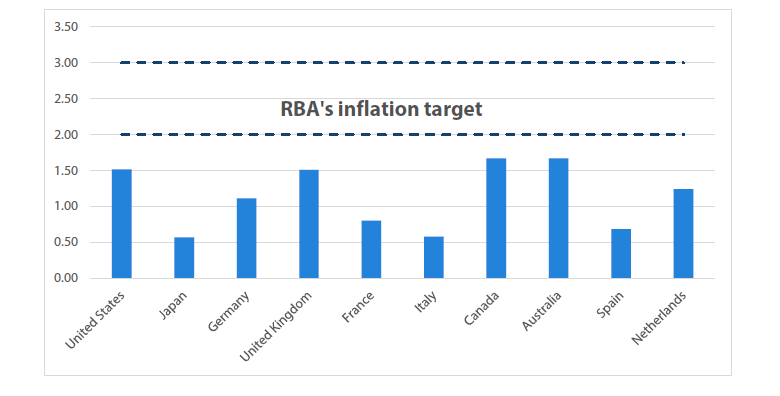
This brings us to the global perspective of unemployment and NAIRU. Looking across the world’s 10 largest developed economies there is little sign of inflation, despite many of these economies having multi-decade low unemployment rates. As an example, over the past five years none of these developed economies have managed to generate an inflation level that would land in the RBA’s 2 – 3% band.
Chart 5 Average inflation rate of the past five years
Source: Bloomberg, Nikko AM
In this set of peers, multiple countries are at multi decade lows of unemployment:
- United States is at 5 decade lows (3.5%)
- United Kingdom at 4 decade lows (3.8%)
- Germany at 3 decade lows (5.0%)
- Japan at 2 decade lows (2.2%)
- Canada at 2 decade lows (5.7%)
While this set of peer countries has slightly lower inflation targets than Australia, it should raise some concern that none of our peers can generate consistent inflation meaningfully above 1.5% despite all-time low unemployment rates and ultra-easy policy (including QE and negative interest rates) across the globe.
The bigger picture question should be: Is an inflation target of 2 – 3% acceptable in the current world environment? Historically, Australia has had a higher rate of inflation than its peers, but arguably we had more to benefit from a once-in-a-lifetime-boom in the Chinese economy that brought huge demands for our commodities. If China is moving from an investment-led economic cycle to one of increasing internal demand, then perhaps Australia should not have a higher inflation target than its developed world peers and we should be looking for alternate explanations as to what is driving inflation, rather than just trying to push unemployment ever lower.
3. What’s keeping inflation low?
The final point is to look at what is causing inflation to be low. The RBA currently identifies three categories that are detracting:
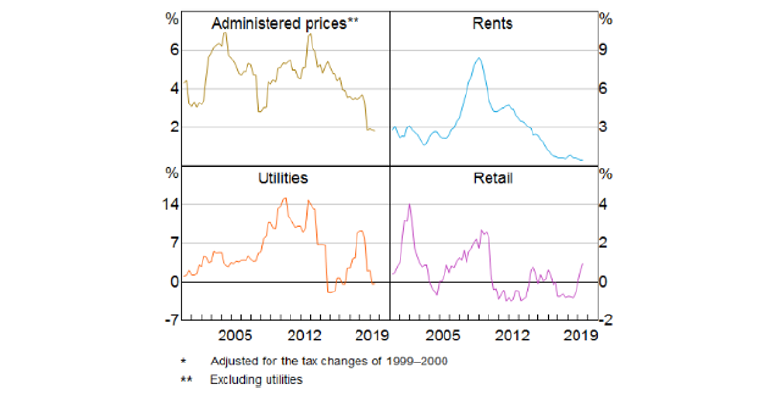
“Another contributing factor is the adjustment in the housing market, with rents increasing at the slowest rate in decades and declines being recorded in the price of building a new home in some cities [refer Chart 6]. Another factor is various government initiatives to address cost-of-living pressures, with these initiatives pushing down inflation in administered prices. The price rises for utilities are also much lower than over recent years. “
— An Economic Update, Phillip Lowe, 24th September 2019
Chart 6 Inflation by component* - year ended
Source: ABS, RBA
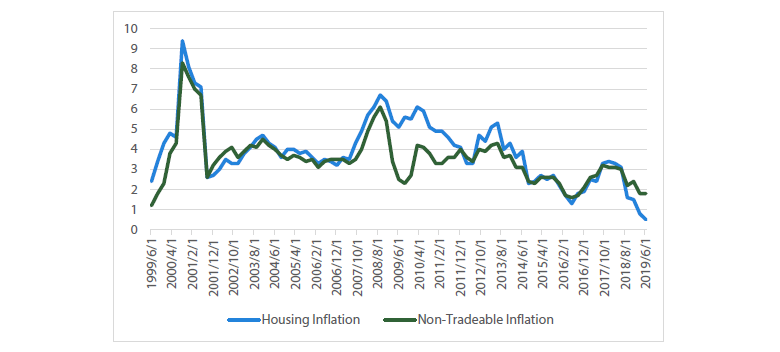
While the push to reduce administered prices and utilities has been strong over the past 12 months, the more interesting decline comes from rents. Arguably, this has been weighing on inflation ever since house prices began declining in late 2017, as the housing component makes up over 20% of the total inflation basket. Chart 7 shows the strong relationship between housing inflation and non-tradeable (domestically generated) inflation.
Chart 7 Inflation components
Source: Bloomberg
The more pertinent point to make, though, is why are rents falling? In recent research from the RBA, two authors discuss what explains rents, showing that prices move with the rental vacancy rate:
“The dominant influence on real rents is the vacancy rate… the effect of an excess supply on housing”
This vacancy rate is explained by demand and supply; that is, how many households will be demanding housing versus how many new houses are being built.
“When extra households are formed, for example due to higher immigration, the market tightens and vacancies fall. When extra stock comes onto the market following a building boom, vacancies rise.”
— A Model of the Australian Housing Market, Saunders & Tulip, January 2019
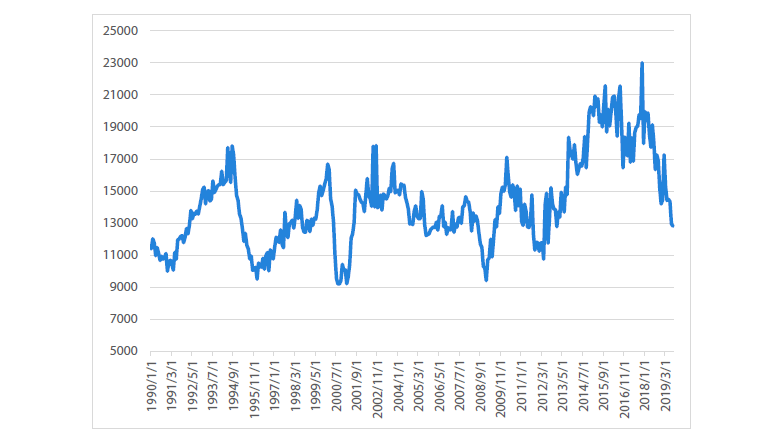
That last sentence is worth reiterating: “When extra stock comes onto the market following a building boom, vacancies rise.” The past three years in the Australian economy have been characterised by a housing construction boom as rising house prices delivered an enormous incentive to build new properties. As this supply comes online, it stands to reason that rents will remain low. Ironically, part of the inflation problem at the moment is being driven by the prior interest rate cuts that gave developers the incentive to build new apartments in large volumes.
Chart 8 Australian building approvals
Source: Bloomberg
Furthermore, given the constant talk of housing affordability in Australia, it’s also pertinent to ask why the population would want faster rising rents, utilities and administrative prices. One of the main arguments against letting inflation slow is that it could cause a deflationary price spiral – that is, if you expect lower prices in the future you will withhold your consumption today and this will actively cause prices to fall in the future. However, this argument seems questionable for this category of goods, as you most likely will be required to live somewhere and have utilities regardless of where you see prices moving in the future.
The takeaway? If the RBA is seeking to drive the unemployment rate down in order to increase inflation, it may need to use more aggressive policy than previously thought. While the RBA has stated multiple times that they are not “inflation nutters”, their current actions paint a picture of a central bank highly committed to meeting their target. It remains to be seen whether they will be able to generate higher-than-average developed world inflation by solely driving down the unemployment rate, but the recent evidence does not point to this occurring in the near term.
This would imply that a zero forecast for the cash rate could soon be on the cards given that most developed nations have been struggling with similar inflation problems. Additionally having a higher than peer average inflation target might require the RBA to take even more drastic action.
2 Unemployment – The broader figures look better
Over the past six months the unemployment rate has been drifting higher, moving away from what the RBA now considers its idea of full employment. Why is this happening?
The unemployment rate consists of two key components:
- the number of people employed
- the number of people in the jobs market.
This gives rise to the effects from both employment growth and participation, as described by the RBA:
“Over recent years, employment growth has consistently surprised on the upside, which is good news. At the same time the strong demand for workers has been met with strong growth in the supply of available workers, with the participation rate now at a record high. Partly as a result of this flexibility on the supply side, unemployment is a little higher than it was at the beginning of the year”
— Remarks at Reserve Bank Board Dinner, Phillip Lowe, 1st October 2019
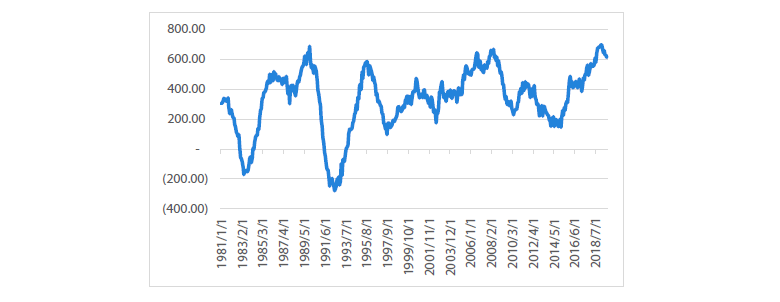
On the employment growth side, the statement from the RBA is in no way an overstatement. The Australian economy has generated extremely high levels of jobs growth over the past two years. This can be seen in Chart 9 as the rolling 24 month sum of employment, which at the beginning of this year was the largest number of jobs created over any 24-month period for the history of the series.
Chart 9 Rolling 24-month sum of employment
Source: Bloomberg
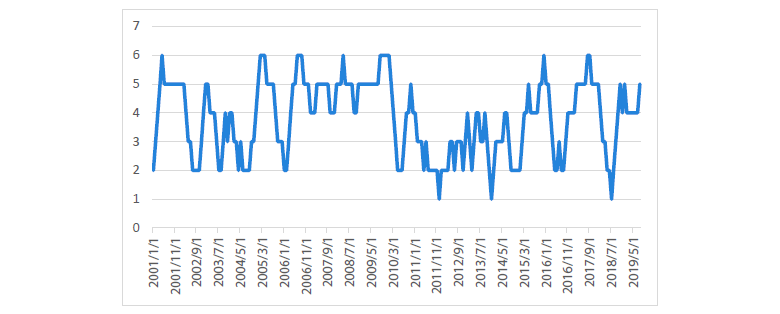
Over the past two years, the Australian economy has generated over 600,000 jobs. This has consistently beaten market expectations for job creation, shown in Chart 10 as the number of times the employment figures beat expectations over a rolling 6-month period.
Chart 10 Number of times employment beat expectations over 6-month period
Source: Bloomberg
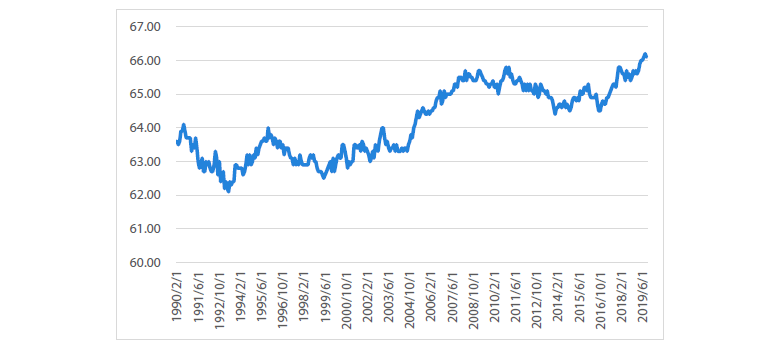
The reason why the unemployment rate has been rising in this environment is because the participation rate is increasing; that is, more and more people are looking for jobs. This is reflected in Chart 11 with the participation rate reaching an all-time high. Two factors have been behind this increase in participation:
- a greater number of female’s joining the workforce
- people aged 65+ remaining in the workforce
Chart 11 Australian participation rate
Source: Bloomberg
1. Women in the workforce
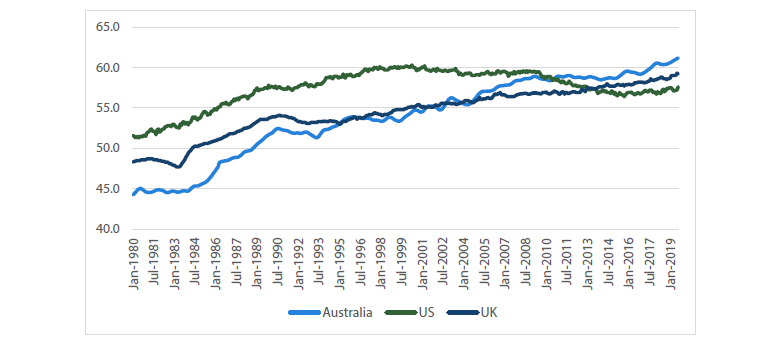
The participation rate of females in the Australian workforce has increased consistently over the past twenty years, but is not drastically above either the United States or the United Kingdom. When the RBA notes that the labour market is showing signs of “spare capacity”, they’re referring, in part, to the fact that a greater number of females are actively seeking employment.
Chart 12 Female participation rate
Source: Australian Bureau of Statistics, Bloomberg
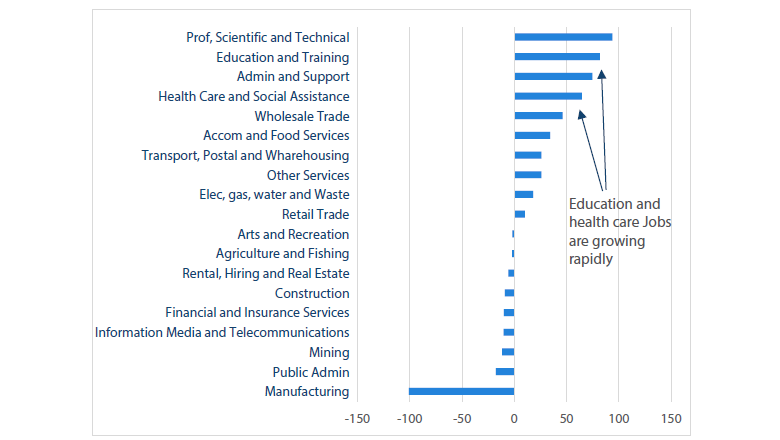
This represents a positive development as females are likely receiving better job opportunities and taking advantage of them, which would be reflected in sector breakdown of current jobs growth. Over the past 12 months, education and health care jobs have been growing rapidly — two industries where women have typically represented a greater share of the workforce, potentially pulling more females into the workforce. However given that female participation is starting to extend above the highs achieved in the US in the early 2000s, and female participation will remain lower than male participation, it could stand to reason that this increased participation will soon begin to slow.
Chart 13 12-months job growth by sector
Source: Australian Bureau of Statistics, Bloomberg
2. Working past age 65
The other increase is coming in those aged 65+ — people are retiring later and remaining in the workforce longer. Given the structure of interest rates and the fact that the Aged Pension is only $413 per week for a single person – then it should not be surprising that for this age group levels of participation are increasing, as people will likely need to stay in the workforce longer in order to afford to live comfortably. This is probably the same group of people who Phillip Lowe refers to when he states “many people” write to the RBA to describe how low rates hurts their finances, as anyone on a fixed income will receive lower returns as the cash rate falls:
“…the Board recognises that the impact of monetary policy on the economy has changed over time, and that there can be some undesirable side effects from low interest rates. The many people who write to me saying how low interest rates are hurting their finances serve as a constant reminder of this.”
— Remarks At Reserve Bank Board Dinner, Phillip Lowe, 1st October 2019
The typical response to these people is that the net benefit of interest rate cuts outweigh the losses for savers. The Australian economy has far more debt than savings, meaning when the RBA cuts they see a net benefit to the economy at large:
“It works to support employment, jobs and income growth across the economy… In doing so, these decisions will promote the collective economic welfare of the Australian people, which we need to remember is the ultimate goal of monetary policy.”
— Remarks At Reserve Bank Board Dinner, Phillip Lowe, 1st October 2019
While this again may be true, for those people in the economy aged 65+ looking for a fixed rate of return on their savings, it does not help their immediate financial requirements. Hence as the level of interest rates on savings declines we should continue to expect to see increased participation occurring in this age group.
The culmination of these outcomes (rising employment and rising participation) mean that the RBA has struggled to get the unemployment rate down to where they would like it. However, we should be asking what does full employment look like: An all-time low percentage in the unemployment rate or strong levels of employment in the total population?
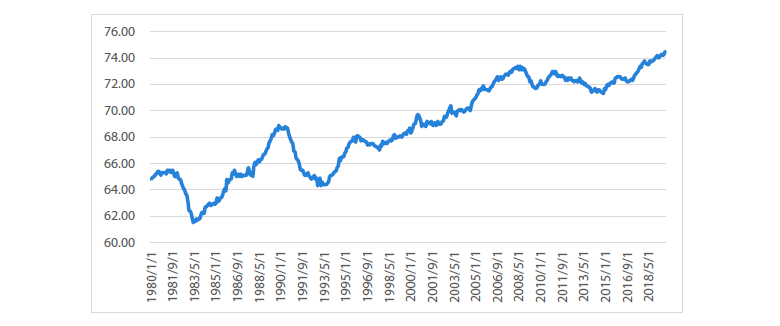
A better indicator of full employment, in our opinion, is the employment-to-population ratio of those aged 16 – 65 (the prime age workforce), which shows the percentage of the population aged 16 – 65 that is employed. Using this measure instead of the unemployment rate would depict a very strong level of employment in the Australian economy, in line with the all-time strong levels of employment growth that we have seen. The “spare capacity” issue seems to be arising because more people are taking this strong jobs market to become employed.
Chart 14 Australia employment to population – aged 15 – 64
Source: Bloomberg
The offset to the positive employment outcome is that the forward indicators have started slowing — business conditions have fallen, job vacancies have slowed and job ads are down — pointing to employment growth slowing over the next 6 to 12 months. The RBA, however, keeps reinforcing that they believe we are at a “gentle turning point” in the economy and that the next 6 to 12 months will be better than the last. If this is true, why the sense of urgency to cut rates three times this year rather than wait to see if employment actually does slow down?
When thinking about where cash rates are headed we believe this also supports an outcome where the RBA does end up cutting rates to zero. If all time high levels of outright jobs gains and all-time highs of employment to population is not enough to slow the RBA down when the unemployment ticks higher, then how far will they push the envelope in a true economic slow-down?
3 Fiscal policy – Don’t look at me
The third broader point to make here is that it seems as if the RBA has lost some hope of receiving help from other parts of the economy. The RBA has stated multiple times over the past six months that while monetary policy can help improve economic outcomes, it is not the only policy option available to Australia.
“In saying that, I also want to recognise that monetary policy is not the only option… One option is for fiscal support, including through spending on infrastructure. This spending not only adds to demand in the economy, but it also adds to the economy's productive capacity. So it works on both the demand and supply side.”
— Speech: Today’s Reduction in the Cash Rate, Phillip Lowe, 4th June 2019
The governor then made a very similar comment in his speech following the July interest rate cut just one month later:
“…over recent times I have been drawing attention to the fact that, as a nation, there are options other than monetary easing for putting us on a better path.
One option is fiscal support, including through spending on infrastructure...It is appropriate to be thinking about further investments in this area, especially with interest rates at a record low, the economy having spare capacity and some of our existing infrastructure struggling to cope with ongoing population growth.”
— Speech: Remarks at Darwin Community Dinner – Phillip Lowe – 2nd July 2019
Interestingly, the reference to fiscal policy as an option was notably absent from the most recent speech following the October rate cut, instead the governor decided to reiterate that they believe monetary policy still works:
“…the Board recognises that the impact of monetary policy on the economy has changed over time, and that there can be some undesirable side effects from low interest rates.
But, importantly, the Board also recognises that monetary policy still works. It works to support employment, jobs and income growth across the economy.”
— Speech: Remarks at Reserve Bank Board Dinner, Phillip Lowe, 1st October 2019
This seems to be signalling that the RBA believes they can achieve their goals on their own and would imply that fiscal easing may not be on its way to help improve inflation outcomes. This would align with recent reporting from the Financial Review quoting Australian Treasurer Josh Frydenberg on the Government’s commitment to achieving a budget surplus:
"Future generations should not be forced to pick up the tab for the last and by paying down Labor’s debt we help build the buffers to guard against future economic shocks.”
— Frydenberg Sticks With Surplus Over Stimulus, Australian Financial Review, 17th September 2019
Hence the RBA might be receiving a clear message from the Federal government: stop looking at us for help and start making progress towards your policy objective.
If true, this would increase the scope of cuts required to get the economy moving in the RBA’s preferred direction; again pointing to a cash rate of zero being an outcome that should not be dismissed.
4 Offshore – The looming risk
The last point to make here is the looming risk coming from offshore. While indicators in the Australian economy look weak (but not terrible), there are a number of signs pointing to a global slow-down that could hurt our economy.
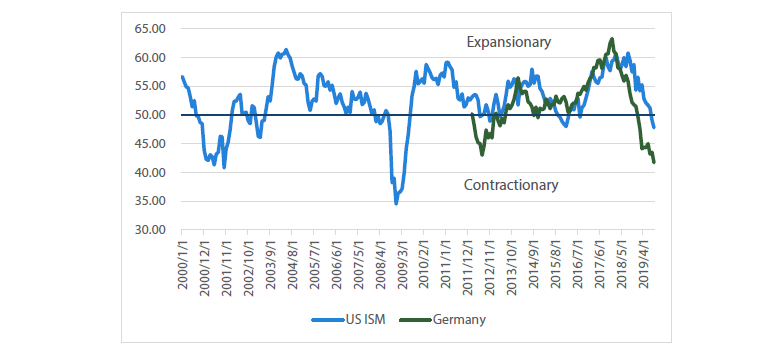
The most obvious of these signs is coming from global manufacturing indexes that have moved into contractionary territory. This includes two of the world’s largest manufacturers — the United States and Germany — dropping into negative territory and recording the worst levels in over 10 years.
Chart 15 Manufacturing PMIs
Source: Bloomberg, Markit
The write ups from manufacturing survey provider Markit make for pretty dour reading:
“Germany's manufacturing sector recorded its worst performance since the depths of the global financial crisis in September…Job shedding also intensified, with factory employment falling to the greatest extent for almost a decade.”
— HIS Markit/BME Germany Manufacturing PMI, 1st October 2019
“U.S manufacturers signalled a further slowdown in overall growth in August, with the PMI dropping to its lowest for almost a decade... The degree of optimism about the year ahead hit a fresh seven-year series low amid growing business uncertainty.”
— HIS Markit US Manufacturing PMI, 3rd September 2019
This has given rise to the age-old idea that we can cut our rates because everyone else is doing it. If the global economy is slowing then the RBA cannot assume the Australian economy will be able to weather a global storm and hence is watching global rates as an indicator of how they should operate:
“The Board also took account of the forces leading to the trend to lower interest rates globally and the effects this trend is having on the Australian economy and inflation outcomes.”
— Statement by Phillip Lowe, Governor: Monetary Policy Decision, 1st October 2019
Given interest rate markets are expecting further interest rate cuts to come from the Federal Reserve, European Central Bank and the Bank of England, it stands to reason that this will lend some credence to the RBA continuing on a cutting path. This could mean either QE is more likely than the RBA currently makes out or there is the potential to see zero rates in the near future.
Conclusion
Over the past three months we have been surprised to see how aggressively the RBA has changed their tone, moving from a small easing bias to looking like they have accepted that their outlook from nine months ago was far too optimistic. While we expected the RBA to be cutting rates this year, just six months ago we had to argue why we still believed that the RBA would even cut rates at all:
“One of the key arguments against further interest rate cuts that we consistently hear is that cutting rates would have little effect as rates are already too low. While we can acknowledge that interest rates look low from an historic perspective, as far as we are aware no central bank has acknowledged that monetary policy is ineffective.”
— Australian Outlook: Making the Case For a Cut, Nikko AM, February 2019
This is a huge turn-around of market expectations and we believe that nothing should be off the table if the global economy is indeed slowing. Furthermore, even if the global economy begins to improve, the RBA has signalled that it could continue cutting as the economy is not yet generating the inflation outcomes that it deems acceptable. Given it seems questionable that we will be the sole developed world economy that is able to consistently generate above 2% inflation, then a cash rate of zero occurring over the medium term does not seem unreasonable.
The lower for longer environment looks like it is here to stay.
Important Information
This material was prepared and is issued by Nikko AM Limited ABN 99 003 376 252 AFSL No: 237563 (Nikko AM Australia). Nikko AM Australia is part of the Nikko AM Group. The information contained in this material is of a general nature only and does not constitute personal advice, nor does it constitute an offer of any financial product. It is for the use of researchers, licensed financial advisers and their authorised representatives, and does not take into account the objectives, financial situation or needs of any individual. The information in this material has been prepared from what is considered to be reliable information, but the accuracy and integrity of the information is not guaranteed. Figures, charts, opinions and other data, including statistics, in this material are current as at the date of publication, unless stated otherwise. The graphs and figures contained in this material include either past or backdated data, and make no promise of future investment returns. Past performance is not an indicator of future performance. Any economic or market forecasts are not guaranteed. Any references to particular securities or sectors are for illustrative purposes only and are as at the date of publication of this material. This is not a recommendation in relation to any named securities or sectors and no warranty or guarantee is provided.


