Summary
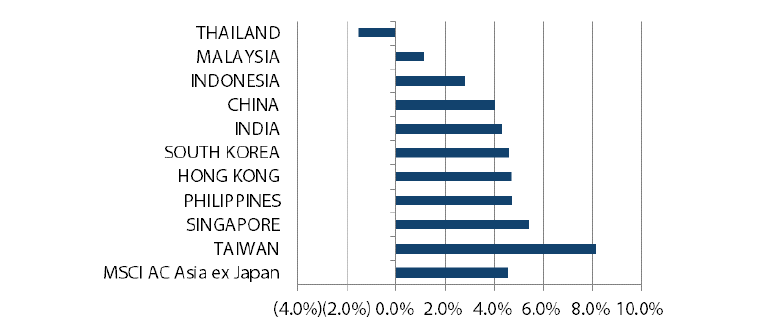
- The rally in Asian stocks gained momentum in October, buoyed by expectations of a partial US-China trade deal and another 25 basis points (bps) interest rate cut by the US Federal Reserve. The MSCI AC Asia ex Japan Index surged 4.55% in US dollar (USD) terms, in line with emerging markets as a whole.
- Taiwan led the gains, rising 8.1% in USD terms in October on the back of a rally in index heavyweight Taiwan Semiconductor Manufacturing Company (TSMC), which reported better-than-expected earnings. Other North Asian markets also did well. South Korea, Hong Kong and China ended the month with gains exceeding 4% in USD terms.
- Elsewhere, India was buoyed by robust company earnings and signs that it is pushing ahead with the sales of its shares in state-owned companies. In the ASEAN region, Thailand bucked the regional uptrend and slumped 1.5% in USD terms in October.
- The anticipation of a "phase one" deal has buoyed markets; continued monetary easing (where possible) will likely prove a kicker to equity markets in the short term. However, China's willingness to commit to the "long march" and continued reluctance to revert to profligate easing suggests a more circumspect stance is warranted over the medium term. Navigating this lower growth world requires a disciplined approach, with a finger on the pulse of longer-term structural trends arising from the proliferation of technology driven/enabled change across industries.
Asian Equity
Market Review
Asian equities surge in October
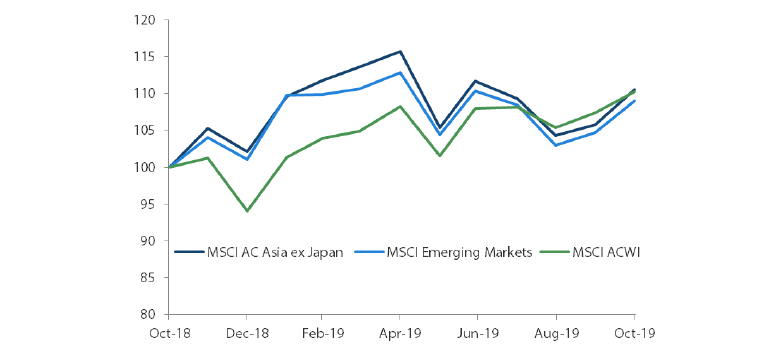
The rally in Asian stocks gained momentum in October, buoyed by expectations of a partial US-China trade deal, with the tariff war between the two nations coming to a temporary halt. Risk appetite also was boosted by another 25 basis points (bps) interest rate cut by the US Federal Reserve, decent US growth numbers and an improvement in China’s manufacturing data. Over the month, the MSCI AC Asia ex Japan Index surged 4.55% in USD terms, in line with emerging markets as a whole. Within the region, Taiwan and Singapore posted the strongest gains, while Thailand and Malaysia underperformed their regional peers.
1-Year Market Performance of MSCI AC Asia ex Japan versus Emerging Markets versus All Country World Index
Source: Bloomberg, 31 October 2019. Returns are in USD. Past performance is not necessarily indicative of future performance.
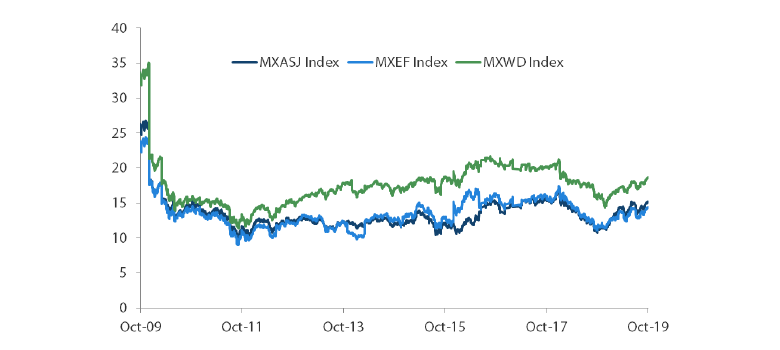
MSCI AC Asia ex Japan versus Emerging Markets versus All Country World Index Price-to-Earnings
Source: Bloomberg, 31 October 2019. Returns are in USD. Past performance is not necessarily indicative of future performance.
Taiwan soars, other North Asian markets also do well
Taiwan stocks surged 8.1% in USD terms in October, lifted by the rally in index heavyweight Taiwan Semiconductor Manufacturing Company (TSMC), which reported better-than expected 3Q earnings. TSMC also gave an upbeat 4Q revenue forecast and raised its 2019 capital expenditure plan by up to USD 5 billion.
In South Korea, stocks advanced 4.6% in US dollar terms, spurred by a 25 bps rate cut by the Bank of Korea and optimism about prospects for the country's semiconductor industry. Despite reporting a 56% fall in 3Q operating profit, Samsung Electronics gave an optimistic outlook, saying that chip sales should pick up in 2020.
In other North Asian markets, Hong Kong and China rose 4.7% and 4.0%, respectively, in USD terms. The Chinese economy grew at a moderate 6% in 3Q 2019 from a year earlier. But sentiment was supported by the country's better-than-expected September official manufacturing Purchasing Managers' Index (PMI) and Caixin PMI, which rose to 49.8 and 51.4, respectively. In Hong Kong, the economy slipped into a technical recession in 3Q 2019, owing to five months of anti-government protests.
Indian stocks reach record highs
Indian stocks gained 4.3% in USD terms in October, reaching record highs after the US cut its interest rates for the third time this year. Optimism about better-than-expected company earnings as well as signs that India is pushing ahead with selling its shares in state-owned companies underpinned market sentiment.
In the ASEAN region, Singapore and the Philippines were the best performers, rising 5.4% and 4.7%, respectively, in USD terms. Indonesia and Malaysia were relatively muted, with respective USD gains of 2.8% and 1.1%. Over the month, the Monetary Authority of Singapore reduced the pace of the Singapore dollar’s appreciation slightly amid subdued growth and low inflation. In the Philippines, the central bank announced a cut in its reserve requirement ratio by 100 bps to boost liquidity, while Bank Indonesia also reduced its benchmark rate by 25 bps to 5%, amid a deteriorating global growth outlook. Bucking the regional uptrend, Thai stocks slumped 1.5% in USD terms in October.
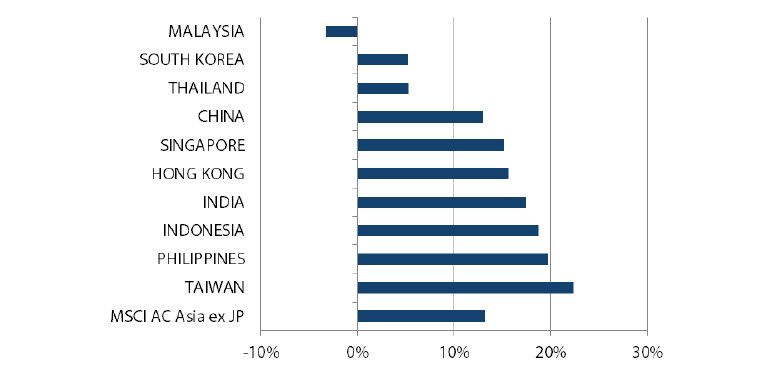
MSCI AC Asia ex Japan Index1
For the month ending 31 October 2019
Source: Bloomberg, 31 October 2019
For the period from 31 October 2018 to 31 October 2019
Source: Bloomberg, 31 October 2019
1Note: Equity returns refer to MSCI indices quoted in USD. Returns are based on historical prices. Past performance is not necessarily indicative of future performance.
Market Outlook
Continued monetary easing to support regional equity markets
The anticipation of a "phase one" deal has buoyed markets; continued monetary easing (where possible) will likely provide a lift to equity markets in the short term. Notwithstanding apparently positive developments on the trade front, China's willingness to commit to the "long march" and continued reluctance to revert to profligate easing suggests that a more circumspect stance is warranted over the medium term. Asia ex-Japan ought to fare better on a weaker US dollar. In addition, markets like India are little affected by the trade wars, while countries in the ASEAN region stand to benefit from reconfiguration of supply chains. Navigating this lower growth world requires a disciplined approach, with a finger on the pulse of longer-term structural trends arising from the proliferation of technology driven/enabled change across industries.
China's handling of the Hong Kong unrest and its (still) persistent commitment to "quality over quantity" augurs well in the long term. This might, however, come at the cost of near term growth for the economy, which has to contend with the trade war. But there could be negative implications for Hong Kong over the longer term. The team retains a preference for structural domestic growth proxies such as insurance, healthcare and software. We also keep our bias toward quality at value.
In India, the economy appears to be emerging from a cyclical nadir brought on by the less than fortuitous timing of a number of structural reforms, in tandem with the global slowdown in growth. However, the Modi government's reform agenda remains in place, and the government is cognizant of the opportunity to play a much larger role in global supply chains. The team prefers to participate in this growth reflation principally through quality private sector banks and real estate.
ASEAN could benefit from the redesign of supply chains
ASEAN is the other region that ought to benefit from the redesign of supply chains currently reliant heavily on China. Indonesia in particular stands out, not least because of its cost advantage; President Joko Widodo’s renewed mandate offers the possibility of real and long overdue structural reform.
The other implication of the redesign of supply chains, particularly those pertaining to technology, is the greater reliance of Chinese companies on Korean and Taiwanese suppliers rather than those in the US. With a cyclical rebound looking increasingly likely, and valuations in pockets offering attractive risk-reward trade-offs, the team favours leaders in niche areas benefiting from long-term trends like healthcare, 5G and energy storage.
Appendix
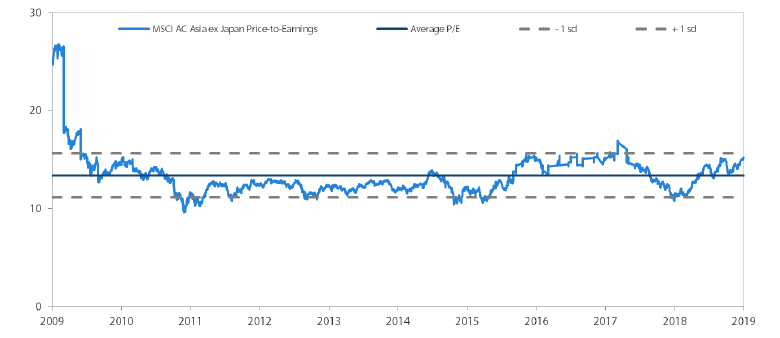
MSCI AC Asia ex Japan Price-to-Earnings
MSCI AC Asia ex Japan Price-to-Book
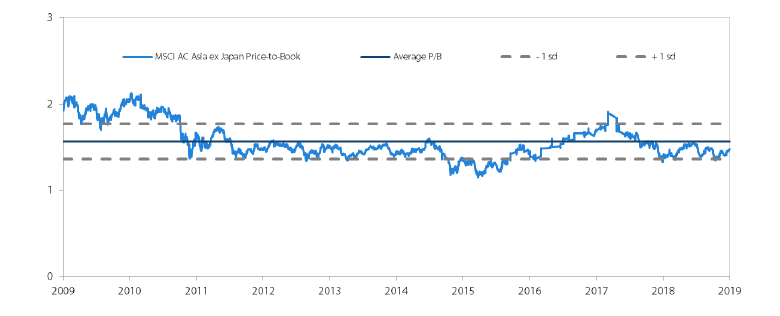
Source: Bloomberg, 31 October 2019. Ratios are computed in USD. The horizontal lines represent the average (the middle line) and one standard deviation on either side of this average for the period shown. Past performance is not necessarily indicative of future performance.


