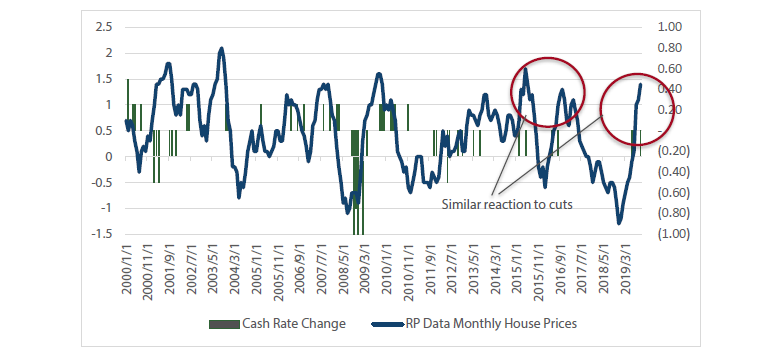
Last month we identified the reason why we believed the Reserve Bank of Australia (RBA) was slowing down on cuts was the fact that the housing market was improving and that strength would eventually show up in the economy. Today, we received a new release of the house price figures that show a great deal of strength is continuing to come through. Prices rose 1.4% in October, which is the strongest monthly increase since March 2015.
Chart 1 Monthly house prices and cash rate
Source: Bloomberg
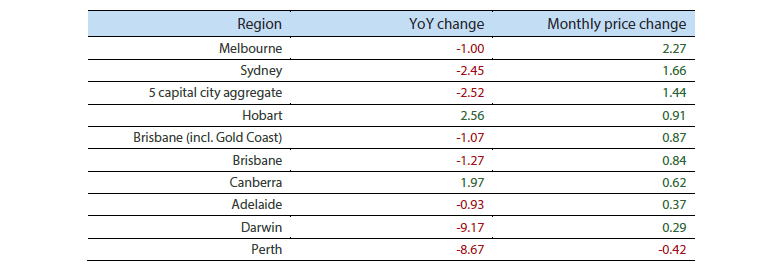
"Both Sydney (+1.7%) and Melbourne (+2.3%) showed very strong increases"
More specifically, both Sydney (+1.7%) and Melbourne (+2.3%) showed very strong increases – two regions that had previously been dragging on prices. Melbourne is now basically flat year-on-year.
Table 1 Change in house prices
Source: CoreLogic
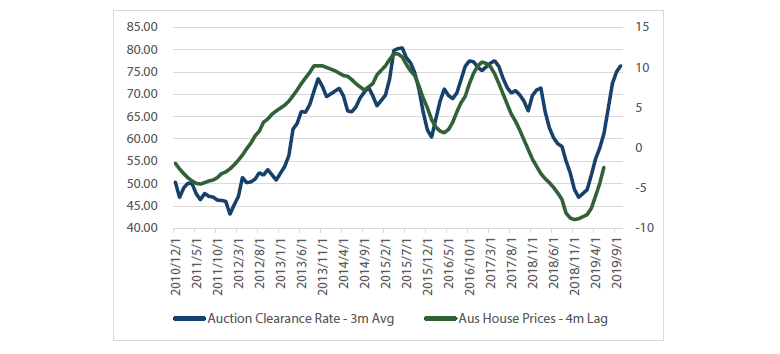
At this time, the forward indicators that we track look very strong. Auction clearance rates are running at around 80% (similar to 2015/2016 levels) and this typically leads prices by about four months. We expect prices should be up about 10% year-on-year in early 2020.
Chart 2 Auction clearance and house prices
Source: Bloomberg
"We expect prices should be up about 10% year-on-year in early 2020"
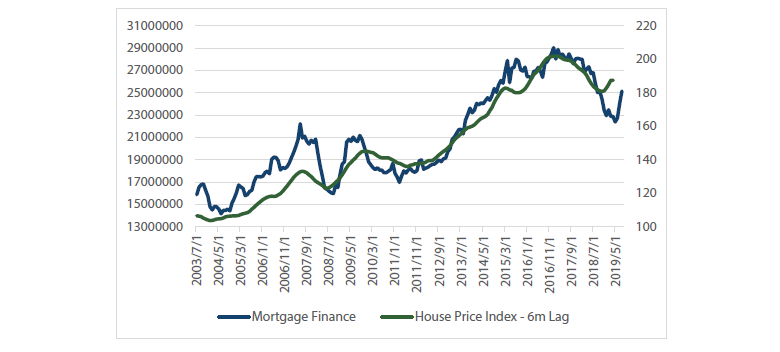
On top of this, finance is starting to come back to the market with a clear turning point being that first RBA cut. Chart 3 shows the jump in the total mortgage approvals, stopping the downtrend of 2018.
Chart 3 Mortgage finance and house prices
Source: Bloomberg
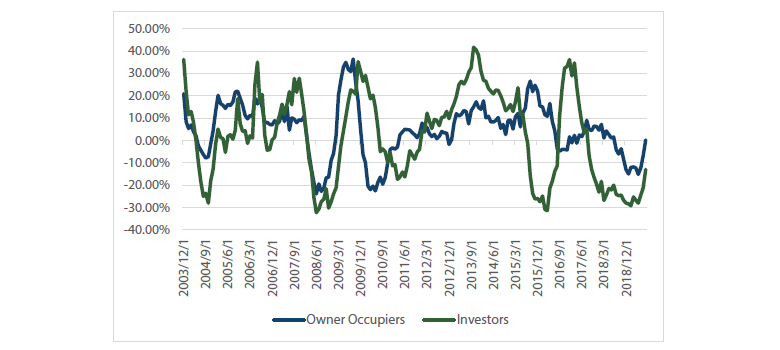
This is coming across both Owner Occupier and Investor, both of which are set to stop contracting.
Chart 4 Australian mortgage finance
Source: Bloomberg
This is likely to continue, as Westpac has begun loosening its lending standards and we would expect the other banks to eventually follow. Here are two examples of what they have done.
Example one

Source: Google
"[This should] entice more borrowing and cause the other majors to easy standards if they want to chase market share"
Example two

Source: google
In no way is this as easy as the policies in 15/16, but easier nonetheless, which should entice more borrowing and cause the other majors to ease standards if they want to chase market share.
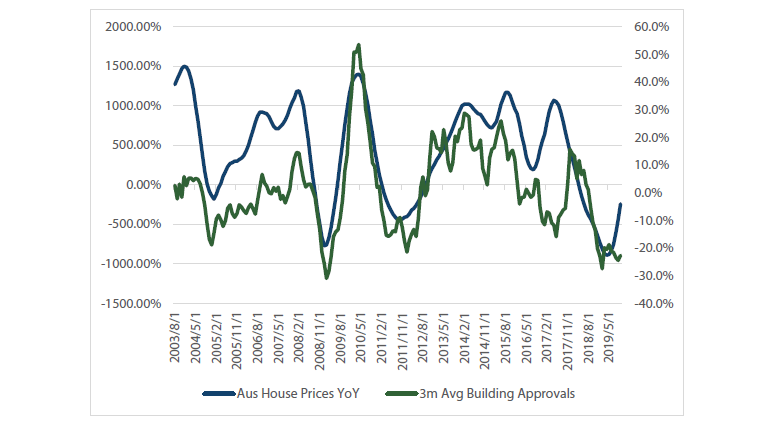
So, what would this mean for the economy? The most obvious place to look is construction/building. People point at all sorts of indicators to explain the drive in residential building approvals, but the best indicator is house prices. When prices rise, developers produce more stock — it’s relatively simple.
Chart 5 Housing prices and building approvals
Source: Bloomberg
"A few more +1.5% rises and the “financial stability” arguments will likely be back in the market about high asset prices/debt"
Part of the reason building approvals slowed was also that investor finance had tightened, making these off-the-plan properties harder to sell. If investor finance starts to rise with prices, this dynamic could quickly change and produce a more positive construction outlook than the RBA currently sees.
We should also see some improvement in retail sales, as the RBA made this comment around why retail had been soft:
"The slowdown in consumption growth in recent quarters has been more pronounced for discretionary items, particularly those typically associated with housing turnover and household wealth…By category, year-ended growth has eased the most since mid-2018 for furnishing & household equipment and sales of new cars."
If this continues, we expect the RBA will become more divided on their views on what sort of house price appreciation is appropriate. For example, this comment in the October minutes from their meeting states that they seem fine with the current risks, but rising prices/household debt would need to be monitored.
"Members also noted that the housing market and other asset prices might be overly inflated by lower interest rates. Members acknowledged that asset prices were part of the transmission mechanism of policy, including by encouraging home building. By themselves, higher asset prices were considered unlikely to present a risk to macroeconomic and financial stability. This assessment would need to be reviewed if rapidly increasing asset prices were accompanied by materially faster credit growth, weak lending standards and rising leverage. Although household debt was still considered high, members saw only a limited risk of excessive borrowing at the current juncture: household disposable income growth (and thus borrowing capacity) is weak; the memory of recent housing price falls is still fresh; and banks are still quite cautious in their appetite to lend. Nonetheless, members assessed that close monitoring of this risk was warranted."
A few more +1.5% rises and the “financial stability” arguments will likely be back in the market about high asset prices/debt.
Conclusion
Overall, we believe this points to the idea that if you expect the RBA to keep cutting over the next six months, it will need to come from concerns outside of the housing market as this outlook will start to shift from a negative to a positive for the economy.
In all likelihood, we believe the RBA will keep rates on hold through to the middle of next year, as rate cuts usually give the housing market a 12 – 18 month runway of price increases.
Important Information
This material was prepared and is issued by Nikko AM Limited ABN 99 003 376 252 AFSL No: 237563 (Nikko AM Australia). Nikko AM Australia is part of the Nikko AM Group. The information contained in this material is of a general nature only and does not constitute personal advice, nor does it constitute an offer of any financial product. It is for the use of researchers, licensed financial advisers and their authorised representatives, and does not take into account the objectives, financial situation or needs of any individual. The information in this material has been prepared from what is considered to be reliable information, but the accuracy and integrity of the information is not guaranteed. Figures, charts, opinions and other data, including statistics, in this material are current as at the date of publication, unless stated otherwise. The graphs and figures contained in this material include either past or backdated data, and make no promise of future investment returns. Past performance is not an indicator of future performance. Any economic or market forecasts are not guaranteed. Any references to particular securities or sectors are for illustrative purposes only and are as at the date of publication of this material. This is not a recommendation in relation to any named securities or sectors and no warranty or guarantee is provided.


