Snapshot
Once again the risk-on, risk-off frenzy has gripped the markets, which have now swung to the upside. Optimism began to mount as US-China trade negotiations resumed with some kind of a "mini" deal thought to become likely. Market sentiment then received a full boost when it appeared that the US had agreed to incrementally roll back tariffs along with progress toward a multi-staged deal, pointing to a potentially more substantive final agreement.
The deal is far from done. But one has to pivot with a change in material facts, which suggest a more optimistic outlook for global growth. Still, all it takes is a tweet for the trade war to resume—think 5 May and 2 August—and as such, we remain ready to pivot back to a defensive stance.
But we think it could be different this time, because the global manufacturing recession has just caught up with the US. Any ratcheting up of tariffs, particularly those scheduled for December, and the accompanying negative impact on the economy would certainly dash any hopes of US President Donald Trump clinching a second term. Both Trump and Chinese President Xi Jinping want, and need, a trade deal. Therefore, the two sides eventually reaching a trade agreement is back as our base case.
Global growth is still disappointing, but purchasing manager's indices (PMIs) are stabilising amid a pick-up in technology sectors such as semiconductors. Meanwhile, China continues to tweak its stimulus, which will likely lifting in its growth by the first half of 2020. It's not an entirely rosy picture. But when one considers that the most recent downturn was due to the confluence of heavy tightening in China, a downturn in the tech sector and sizable uncertainty owing to trade wars, the stabilisation by these drivers point to a better outlook.
The recent period has been compared to the downturns in 2012 and 2015. Both were initiated by China's tightening that slowed global demand and hampered trade, resulting in a global manufacturing recession similar to what we are experiencing today. But unlike before, China is currently aiming to foster quality growth and is therefore refraining from creating a credit bonanza that some nonetheless feel is necessary to get the global economy back on its feet.
China's push toward quality growth is actually working despite a tight property market, slowing exports and some weakness in consumption. Notably, the Chinese manufacturing sector is shifting up the value chain, in turn impacting semiconductors and other hardware. This helps boost the sector's growth and ease the fallout from US threats to cut off supplies to companies such as Huawei.
This growth is not lifting global demand as a fresh credit binge would. But the manufacturing cycle does appear to be bottoming and demand looks stable. As manufacturing picks up and inventories build up anew, they have the potential to start generating global demand.
Investment bears close watching, as it has been disappointing for some time, especially with uncertainty stemming from the trade war. A prolonged period of low investment coupled with a manufacturing recession has the potential to negatively affect employment and services, and the odds of a broader recession would increase significantly. However, data released so far suggests we are still some distance from a more widespread recession.
In the meantime, the markets are likely to remain edgy on the ebb and flow of trade negotiations and mixed macro data. Not surprisingly, optimism is giving equities a lift for now, with US shares reaching new highs. However, we see better opportunities in beaten down markets, such as China, which has far more upside potential. We are cautious on bonds although most of the recessionary risk priced in throughout August has been removed.
We are ready to respond to economic data and material events that could quickly change investor outlook, such as a tweet out of the blue. The outlook could deteriorate quite rapidly considering the delicate global demand balance, and we need to be ready to either cut risk or add downside protection.
Asset Class Hierarchy (Team view1)
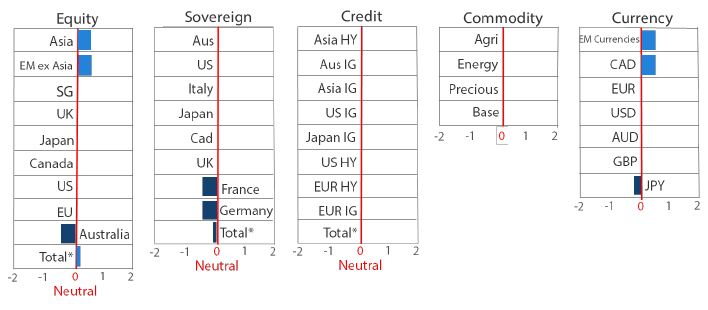
* Total scores for Equity, Sovereign and Credit are weighted average scores, which are computed using market cap weights.
1The asset classes or sectors mentioned herein are a reflection of the portfolio manager’s current view of the investment strategies taken on behalf of the portfolio managed. These comments should not be constituted as an investment research or recommendation advice. Any prediction, projection or forecast on sectors, the economy and/or the market trends is not necessarily indicative of their future state or likely performances.
Research Views
We have adjusted our asset class views and hierarchies as discussed below.
Global equities
In October, we pivoted from cautious and slightly underweight to more constructive and slightly overweight. This was a function of positive US-China trade negotiation developments, including a potential roll-back of tariffs, and some evidence that the manufacturing recession could be bottoming out and helping boost global demand.
Our preference is for emerging markets (EM) as the US is reaching new highs accompanied by lofty valuations and fairly flat earnings growth. We also believe that the dollar may have peaked, providing a further tailwind across EM. Asia in general, and China in particular, have suffered deeper drawdowns due to slowing demand and trade war uncertainty. Therefore the region could see the most upside as these pressures subside. In China, we focus not just on the value opportunity but also still-supportive earnings.
Traditional measures of China’s economic health including fixed asset investment (FAI) and the credit impulse continue to disappoint, particularly for the rest of the world that depends on Chinese demand for its exports. However, the Caixin manufacturing new orders PMI—a better measure of the health of private firms—has lifted from just above 50 in August to 52 in September, a level not seen since early 2018.
Stimulus in the form of tax cuts and better access to cheaper capital is helping the private sector. At the same time, the fall in demand for manufactured exports is now being replaced with domestic demand for semiconductors and other high tech parts—an important development in the wake of US threats to cut off supplies to Huawei and potentially its peers as well.
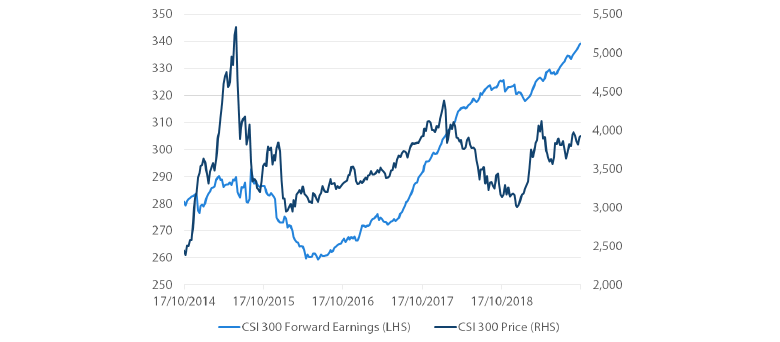
Forward earnings estimates in the A-share market have been lifted since the end of January through both top line growth and improving profit margins. Prices always follow earnings over the long term. But needless to say, the trade war has not helped sentiment. Prices have diverged to the downside and there is decent upside potential in the event of a trade deal.
Chart 1: CSI 300 Earnings picking up while prices moving sideways
Source: Bloomberg, October 2019
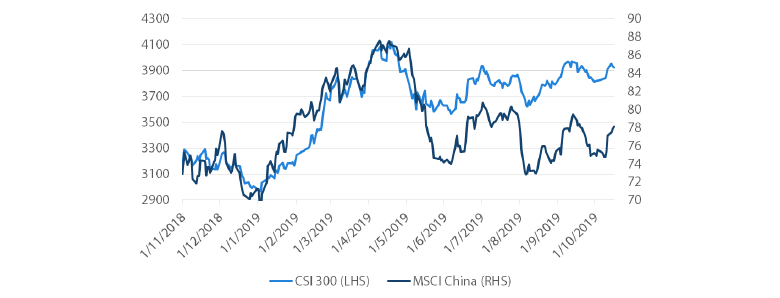
While A-share performance is disappointing, MSCI China, with sectors more representative of "old China", has performed considerably worse on the trade war and still-disappointing growth in old China sectors.
Chart 2: China A Shares (CSI 300) versus MSCI China
Source: Bloomberg, October 2019
Global bonds
We have downgraded our views on global government bonds. Demand for risk-free assets has waned as sentiment has shifted on the following factors:
- The ongoing trade conflict. Signals coming from US-China trade negotiations have led to cautious optimism toward the two sides reaching an initial ‘phase one’ deal. The prospect of both countries rolling back some tariffs would be an added bonus to the markets, as initial focus was on the possibility of the US cancelling additional tariffs due in December at the same time as an increase in purchases of US agricultural goods by China.
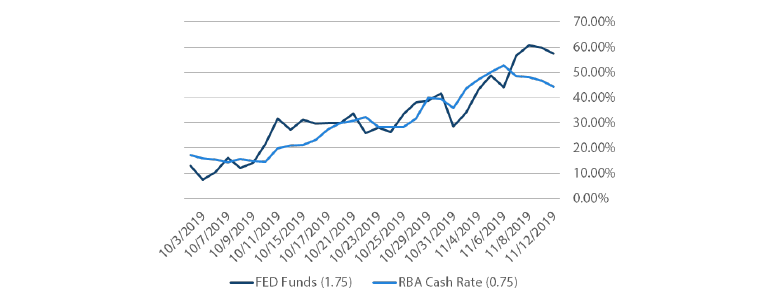
- A change in expectations for global monetary policy. Two major central banks—the US Federal Reserve (Fed) and the Reserve Bank of Australia (RBA)—have been delivering lower cash rates in 2019 and, until recently, the markets expected the easing cycles to continue. However, in their recent communications both Fed Chairman Jerome Powell and RBA Governor Philip Lowe have begun guiding investors towards a pause and it appears that the markets have been listening. Chart 3 shows the probabilities for the Fed’s and RBA’s monetary policies being unchanged in June 2020. US investors are now implying a 60% chance that the Fed Funds rate will remain in the current range of 1.5%-1.75% through June 2020, with the probability up from 10% six weeks ago. Similarly, during the same time period Australian investors’ expectations that the current cash rate of 0.75% will remain unchanged through next June have climbed to 45% from 15%.
Chart 3: Probability of no change in current cash rates for June 2020 meetings
Source: Bloomberg, November 2019
The outcome of trade negotiations and the market’s assessment of future monetary policy are certainly linked; in the last few months, cooling trade tensions have coincided with improving outlooks from central banks. While we have turned cautious on global bond exposures in the face of better trade news and lower prospects for additional global monetary easing, we remain aware that the pendulum can swing back quickly as we have witnessed before under the current US president.
Global credit
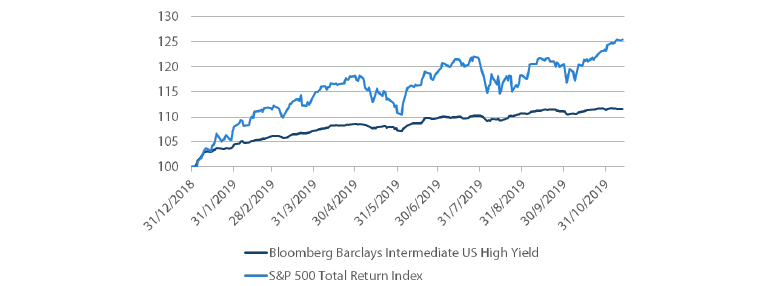
Global credit spreads have largely held steady over the last few months, but duration risk has come to the fore as government benchmark yields have risen. We believe that the positive factors that enhanced risk appetite and increased demand for global equities will also benefit credit, in particular high yield bonds. We have upgraded high yield credit due to this change in sentiment; furthermore, the sector entails less duration risk and this is another factor that prompted the upgrade. Chart 4 shows the strong returns from the US high yield sector in 2019, along with the tailwind from US equities.
Chart 4: US high yield and S&P 500 YTD returns (indexed to 100)
Source: Bloomberg, November 2019
FX
As optimism grew on trade deal hopes, stabilising global growth and a third Fed rate cut, the “risk on” mode saw the US dollar (USD) weaken slightly and EM currencies rally. The pound (GBP) surged as uncertainty diminished towards a hard Brexit and December’s UK election.
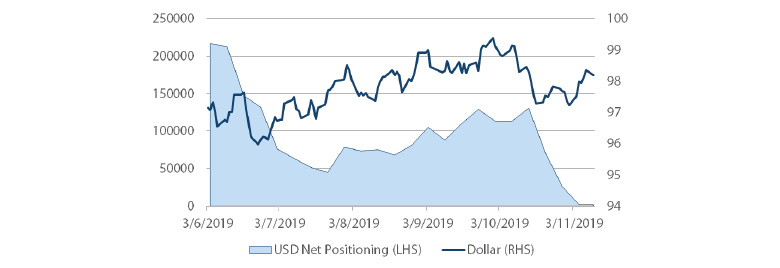
Despite three rate cuts since July, the dollar has been holding up rather well. This is largely due to the growth advantage the US enjoys relative to other economies, net long positioning and positive momentum. But each of these pillars of support is beginning to buckle, in our view. US growth is slowing relative to the rest of the world, including China, and renewed optimism concerning a trade deal has shifted flows from the US to EM—Asia in particular. As Chart 5 shows, net speculative positioning remained quite long until mid-October when it collapsed to nearly neutral levels by month-end. Momentum remains positive, but these dynamics suggest it may soon break to the downside.
With the next US presidential election on the horizon, any economic data that points towards a slowdown in broader growth could lead to additional policy easing by the Fed. The resulting reduction in policy rates could further erode the carry advantage the dollar enjoys, putting the currency back on the defensive.
Chart 5: USD net positioning versus Dollar index
Source: Bloomberg, November 2019
Commodities
Back in August, gold benefitted from a collapse in bond yields and escalating geopolitical risks, but the safe haven asset has since faced headwinds from de-escalating geopolitical tensions and a corresponding bounce in global yields. Even so, we expect some support for gold coming from a weaker dollar, weighed down by some degree of currency debasement as central banks around the world turn to further easing.
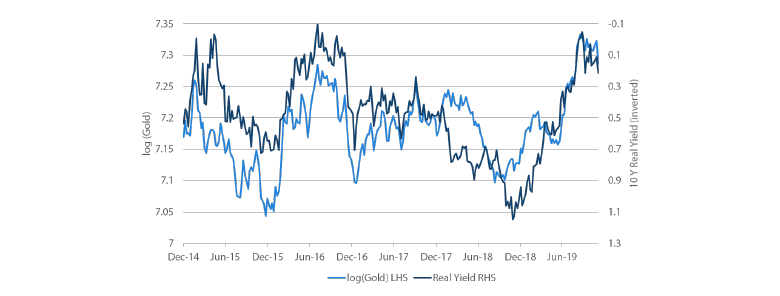
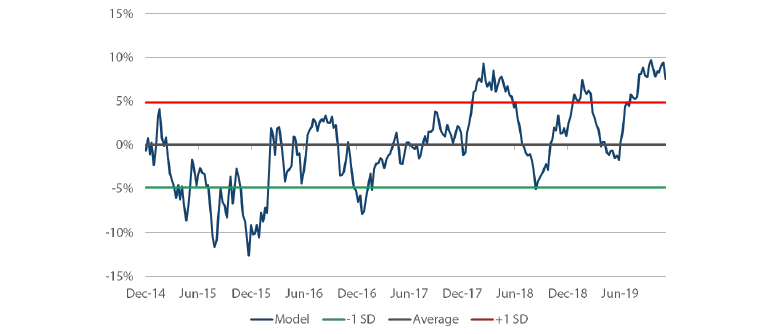
While gold has sold off, it is still outperforming bonds. Chart 6 shows how real US yields are negatively correlated to gold prices. As real yields decline, gold prices rise; conversely, as real yields rise as they have been doing lately, gold prices tend to fall.
Chart 6: Gold versus real US yields
Source: Bloomberg, Energy Intelligence Group, August 2019
However, this relationship doesn’t always hold true. As Chart 7 shows, gold has lately been outperforming bonds, and one could argue that gold prices are now expensive. While this is certainly a risk to gold prices, we also see the precious metal finding support through central bank easing and potential dollar weakness.
Chart 7: Gold premium / discount to real US yields
Source: Bloomberg, Energy Intelligence Group, August 2019
Process
