Snapshot
Financial markets navigated several geopolitical events last year and any hopes that this new year would be one of relative calm were shattered before the end of the first week. The first steps for risk assets in 2020 were shaky ones as the US administration authorised a lethal strike on one of Iran’s top military leaders. Oil prices spiked, safe haven assets rallied and global equities fell. While this is certainly not how investors wanted to start the year, it is important to maintain an even keel and keep in mind the lessons of last year.
In 2019, global equities had plenty to contend with in the Middle East, including the downing of a US drone by Iran over the Strait of Hormuz, an attack on Saudi oil infrastructure and the Turkish incursion into northeast Syria. While opinions may differ on the severity of these various events, they all share a common thread in drawing out commentators painting the worst case scenarios. Nevertheless, US and European equities still delivered strong returns of over 25% in US dollar (USD) terms in 2019. For US equities in particular, 2019 was one of eight annual returns greater than 25% in the last 30 years. While it may be tempting to expect markets to take a breather after such strong gains, it is important to remember that momentum is also a powerful force. The following years to each of these eight years were also positive ones, and it seems that vertigo would not have been a useful investment strategy.
Two other concerns that eclipsed Middle East events—namely US-China trade negotiations and Brexit—have taken on decidedly less ominous tones. January should see the signing of a “phase one” trade deal that lessens the risk of further tit-for-tat trade tariffs between US and China in the near term. Meanwhile, British prime minister Boris Johnson’s emphatic victory in the UK elections gives him the strong majority needed to agree a deal for the UK to finally exit the European Union (EU). Both outcomes will help maintain healthy risk appetites to start the year and contribute to better returns from non-US equities, allowing them to catch up to US outperformance over the last few years.
The early beneficiaries of this rocky start to the year were global sovereign bonds as safe haven flows pushed yields lower. Nevertheless, we expect government bonds to struggle to maintain positive returns as the year progresses. The starting point of very low to negative yield levels will be a persistent headwind to fixed income performance. While government bonds will continue to offer risk mitigation qualities in a multi asset portfolio, lower allocations will likely be rewarded as bonds struggle to keep up with other asset classes in the face of an improving global outlook.
Asset class hierarchy (team view1)
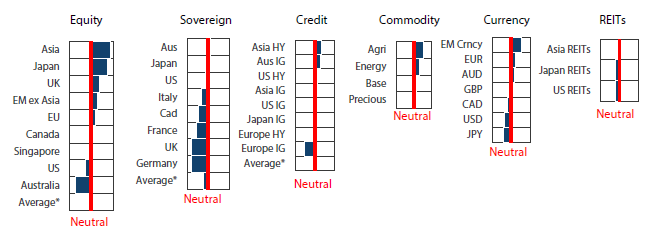
* Average scores for equity, sovereign and credit are weighted average scores, which are computed using market cap weights.
1The asset classes or sectors mentioned herein are a reflection of the portfolio manager’s current view of the investment strategies taken on behalf of the portfolio managed. These comments should not be constituted as an investment research or recommendation advice. Any prediction, projection or forecast on sectors, the economy and/or the market trends is not necessarily indicative of their future state or likely performances.
Research Views
We make adjustments to our asset class views and hierarchies as discussed below.
Global equities
The overweight to Japan equities was increased marginally on account of better growth prospects and reduced geopolitical risks, including the completion of a phase one US-China trade deal and a favourable UK election outcome reducing the chances of a hard Brexit.
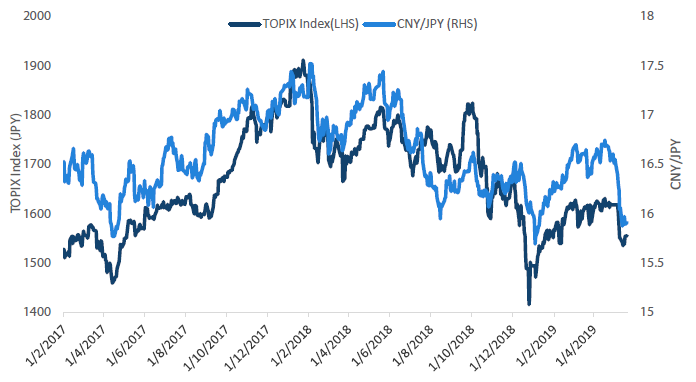
However, the recent rise in geopolitical risks in the Middle East predictably lifted the Japanese yen, which has proven to be a near-term headwind to Japan equities as shown in Chart 1. Should events continue to turn for the worse with a potential direct war between the US and Iran being the worst case, this macro dynamic would likely stay in play, but this is not our base case.
Chart 1:TOPIX Index versus CNY/JPY
Source: Bloomberg, January 2020
The yen tends to strengthen as global bond yields compress on a flight to safety, but given that further escalation between the US and Iran has been averted for the time being, we believe bond yields are more likely to rise on a better growth outlook. Rising yields more often than not translates to a weaker yen and therefore better support for Japan equities.
While Japan equities have the tendency to follow the direction of the “risk-off” yen, they remain supported by strong fundamentals including attractive valuations and better earnings prospects as growth continues to improve.
Global bonds
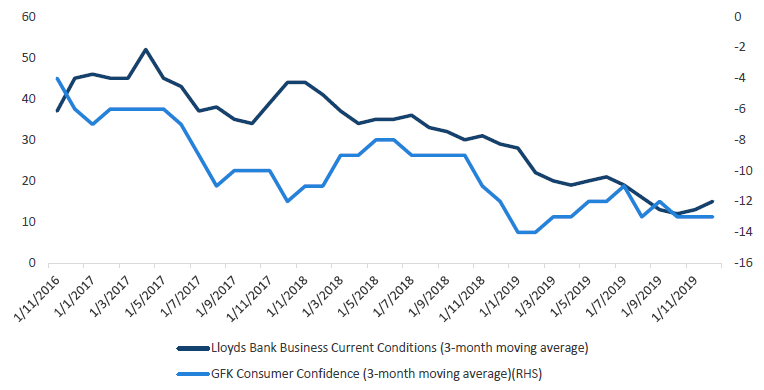
We expect government bonds to struggle to repeat the strong performance of 2019, with some markets finding it harder than others. UK gilts is one such market that we expect to underperform its global peers. The past three years following the UK vote to leave the EU have indeed been difficult for businesses and consumers alike. Chart 2 shows clear downtrends in UK business and consumer confidence indices since the vote in 2016. This pessimism has also been reflected in the markets’ pricing of Bank of England (BOE) monetary policy, with additional accommodation expected later this year.
Chart 2: UK business and consumer confidence
Source: Bloomberg, December 2019
We expect the gilt market to be disappointed as the UK and global economies stabilise and then recover in 2020. The resounding election victory by the Conservative Party has finally given a UK prime minister the votes in parliament needed to take the UK out of the EU in an orderly fashion. While some uncertainty will no doubt remain around the future trading relationship with Europe, the threat of a disorderly exit has been essentially minimised. The BOE had stood ready to respond to a hard Brexit but can now stand down. The central bank’s otherwise positive outlook for the economy will come to the fore, resulting in a steeper yield curve and greater consideration given to the possibility that the next move in the UK official bank rate will be higher.
Global credit
Within the global credit sector, an important allocation decision is the choice between high yield (HY) and investment grade (IG) bonds. Direct investment at the individual bond level can be difficult due to liquidity and size considerations so investors often resort to using ETFs for these exposures. In this case it is important to consider the relevant index characteristics as a key part of the investment decision. Two main factors are the weighted average yield, representing the return compensation for assuming the credit risk, and the interest rate risk due to changes in the level of benchmark government yields represented by modified duration.
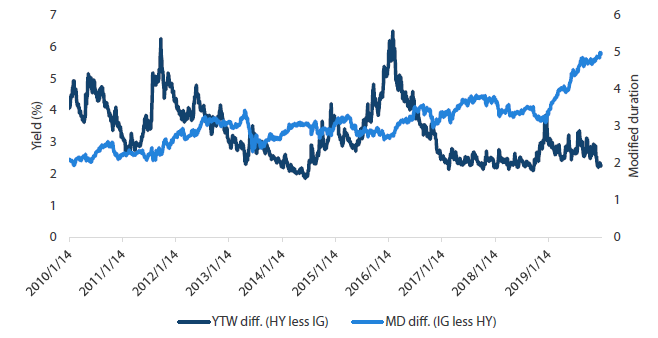
Using the Bloomberg Barclays indices for each, we show the differences between US HY and IG for yield and modified duration in Chart 3. Not surprisingly, HY consistently offers a higher yield than IG, but it currently sits at the tighter end of the 10-year range with HY above IG by 2.25%. Conversely, IG duration is much longer than HY with the current difference of five years the largest in over 10 years.
We draw two interesting observations from this data. The first is that the yield compensation of 2.25% for choosing HY over IG is potentially more attractive than it appears, even though it is historically low. The reason is that in prior periods when the difference was similarly narrow, 2014 and 2017-2018, the difference in duration was much smaller at 2.5–3.5 years, compared to the current five years. In other words, HY investors are receiving greater yield compensation for less duration risk relative to IG today. The second observation is that given the large difference in duration, any change in the level of benchmark government bonds will also be an important determinant of the winner between HY and IG returns in 2020.
Chart 3: Comparison of yield to worst (YTW) and modified duration (MD) for US high yield and investment grade
Source: Bloomberg Barclays Indices, Bloomberg, January 2020
FX
The US dollar weakened in December as we crossed the year-end without major surprises. It then subsequently rebounded as the US-Iran military situation drove demand for safe assets. Emerging markets (EM) currencies strengthened as the US and China made progress towards signing a “phase one” trade deal. Following BOE hints of upcoming rate cuts on the back of a softer UK economy and the passing of the Brexit bill, post-election optimism wore off and saw the pound return to pre-election levels.
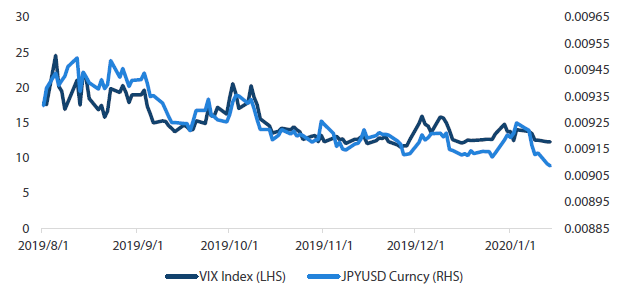
Although the Japanese yen traded in range during the last quarter of 2019, the six-month correlation between the VIX index (30 day expected volatility) and JPY/USD has been high at 0.57. Yen performance has been closely aligned with its safe haven status during risk-off periods, as seen lately when geopolitical tensions between Iran and the US escalated. In fact, a rise in expected volatility has been more closely correlated to yen strength than an increase in gold prices, despite gold being the traditional risk haven asset. Hefty overseas assets and investor carry trades due to the low interest rate environment in Japan are some of the drivers which have resulted in higher demand for the yen in a risk-off event.
Looking ahead, growth is expected to be broadly supportive of higher bond yields and therefore a weaker yen. However, risk sentiment might continue to see-saw on the back of geopolitical developments. Under such conditions, the yen is likely to continue behaving as a safe haven asset in risk-off periods.
Chart 4: VIX Index versus JPY/USD Currency
Source: Bloomberg, January 2020
Commodities
Among the list of items in the “phase one” deal between the US and China, agricultural product orders would perhaps be the easiest to agree on and implement. China is the world’s biggest agriculture market, accounting for 41% of the world’s soybean imports according to the Food and Agriculture Organization, while the US is the world’s biggest crop producer and farmers’ votes are crucial to Trump’s re-election. The two countries are perfectly complementary and China has increased US soybean imports by six times from 2000 to 2017.
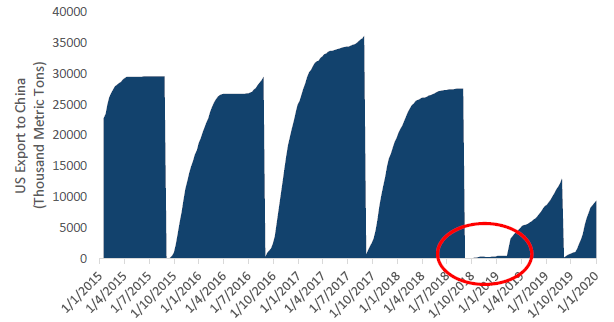
The trade war has been painful for US farmers and agriculture prices as China almost completely suspended imports from the US between September 2018 and early 2019, during a critical seasonal window when most of its exports are historically done. The “phase one” deal would require China to significantly ramp up US purchases, even if just to levels before the trade war.
Chart 5: US soybeans accumulated exports to China
Source: USDA, Bloomberg, January 2020
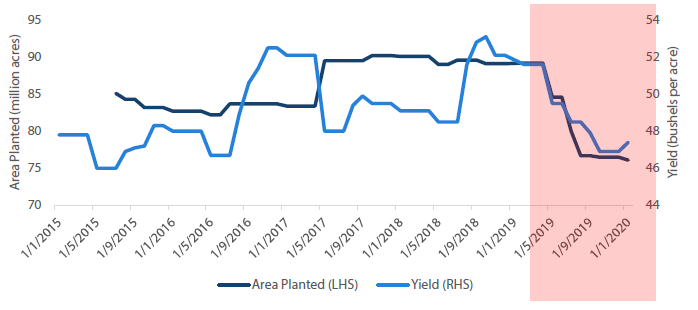
There are constraints, however. US farmers were badly wounded in 2018. Consequentially they planted less, while crop yields have been consistently revised down due to bad weather in the summer of 2019. The supply and demand factors are strongly supportive and we believe the still-depressed prices should continue to recover.
Chart 6:US soybeans supply
Source: USDA, Bloomberg, January 2020
REITs and infrastructure
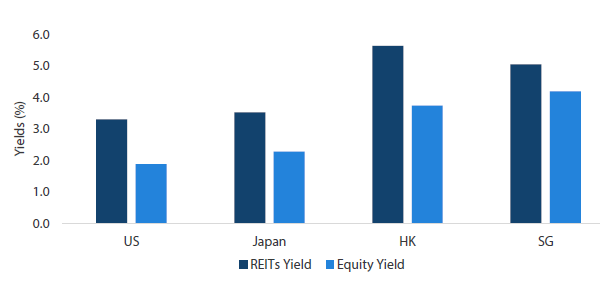
A real estate investment trust (REIT) invests in real estate properties and distributes revenues (mainly rental income) from these assets regularly to investors. Real estate properties include retail shopping malls, office towers, industrial buildings and hotels. REITs are generally required to return 90% of taxable income as dividends to their investors, resulting in higher yields compared to traditional equity. In addition, REITs’ returns typically benefit from low interest rates, which drive down their financing costs and improve their valuations. Therefore REITs are also known as bond-proxy assets in the equities space. Besides interest rate risks, other major risks include deteriorating rental income arising from high property vacancy rates and severe economic downturns.
Chart 7: REITs versus equity yield comparison
Source: Bloomberg, January 2020
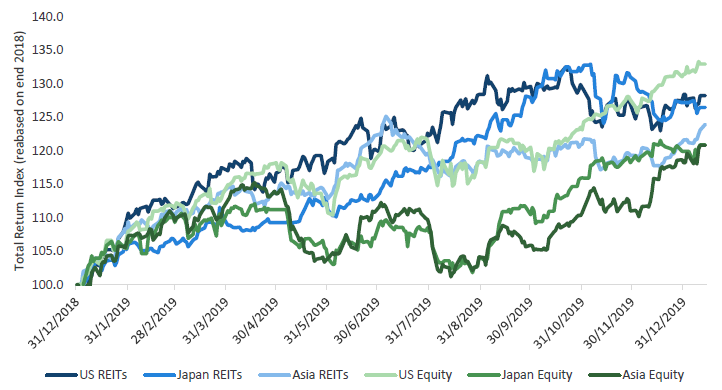
2019 marked one of the best years for REITs and infrastructure assets. All major REITs markets under our coverage (Asia, US and Japan REITs) achieved more than 20% total returns, and Asia and Japan REITs even outperformed their corresponding equity indices. Their exceptional 2019 performance was primarily driven by falling interest rates (sovereign yields) and investors’ risk-aversion inflows into defensive stocks, including REITs. REITs provide high dividends compared to traditional stocks and relatively stable cash flows, which were favoured by investors amid last year’s weak economy and trade tariff uncertainties.
Chart 8: REITs versus equity performance
Source: Bloomberg, January 2020
Currently, our REITs asset class score is rated Neutral -, considering their expensive valuations and potential negative macro headwinds. In December last year, the US and China agreed on a “phase one” deal, and UK prime minister Boris Johnson firmly returned to power with a large majority in the general election. These two events moderately beat markets' expectations and largely removed geopolitical tail risks (at least in the short term). Risky assets rallied and safe haven assets such as US Treasuries and Japanese government bonds were sold off. REITs performance typically struggles under rising rates environments, and our sovereign outlook is bearish lately. Within the REITs markets, we downgraded US REITs to the bottom of our hierarchy, as it is the most sensitive to rising rates. On the other hand, we are more positive on the more growth-oriented Asian REITs (Singapore and Hong Kong).
Process
