Green shoots of growth have arrived on the back of a manufacturing upturn, ample central bank liquidity and a phase one US-China trade deal that has helped restore confidence around the world. However, the recent coronavirus outbreak brings an entirely new set of challenges for the weeks and months ahead.
Until early January, the growth outlook for emerging markets appeared quite rosy. After a global growth scare in 4Q19, evidence of a manufacturing upturn, most notably in the tech sector, and an uptick in Chinese demand suggested that global growth was on the mend. The signing of the phase one US-China trade deal further lifted confidence.
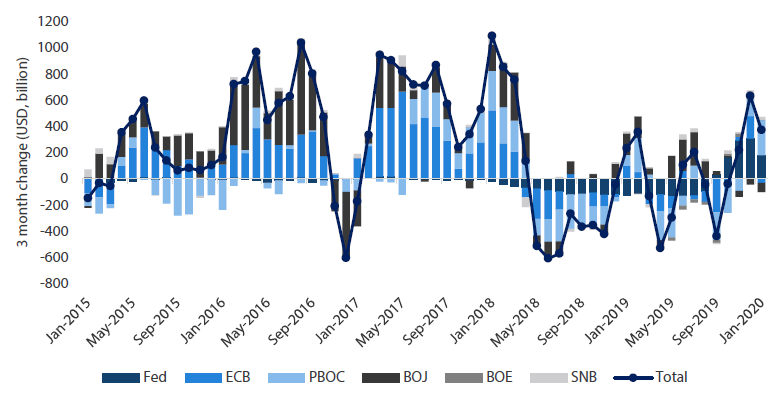
Importantly, the US Federal Reserve (Fed) delivered on its dovish pivot in late 2019 with rate cuts and a sharp turn from quantitative tightening to easing. As shown in Chart 1, central banks around the world are once again expanding their balance sheets and lifting liquidity, giving an extra boost to risk appetite.
Chart 1: Central bank balance sheet expansion accelerates
Source: Bloomberg, January 2020
However, the coronavirus outbreak presents a new headwind as the extensive efforts to contain it slows down global trade in the process. Compared to the SARS outbreak of 2003, the coronavirus is spreading more quickly, but efforts to contain it have also been stronger.
Weaker Chinese consumption following the coronavirus outbreak will weigh on the region, but less is certain about the epidemic’s impact on the supply chain. Caution is warranted, at least until there is better visibility on the effectiveness of the containment and the extent of the collateral damage. Assuming that a deadly pandemic will be avoided, which is the likely base case, demand should rebound much as it did back in 2003 after the SARS outbreak.
Asia: Opportunities in the north
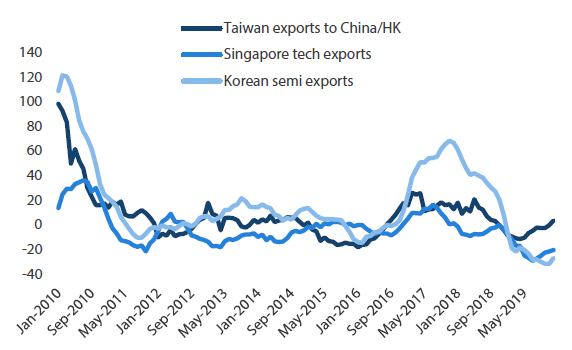
Demand in Asia is improving, particularly in the northern part of the region. Taiwan and South Korea are finally seeing improvements in trade—specifically in semiconductors and electronics with the manufacturing cycle finally on the mend. China’s growth is tepid; that said, it is also high in quality and will therefore feed back into private sector growth and earnings.
The coronavirus is clearly negative for Chinese demand in the near term, but most of the lost demand should be restored if the virus is effectively contained. The recovery in China and Asia is still nascent and therefore a virus-induced demand shock could derail the demand cycle again. But should it be required, the authorities still have enough policy ammunition at their disposal to shore up demand.
Outside of China, Taiwan and South Korea are exposed mainly to supply chain disruptions. ASEAN will be feeling the effects of weaker Chinese consumption, most notably in tourism, which has all but ground to a halt. ASEAN still benefits from reconfigured supply chains and an impending fiscal boost, but local demand is still relatively weak, leaving the region vulnerable.
India not only suffers from weak growth—its available countermeasures are limited. India’s recent corporate tax cut will not have a strong impact on growth, and it also reduces future policy options available to the government. Inflation in India recently spiked, also narrowing the country’s monetary easing capacity. India is a relatively closed economy and is therefore less dependent on Chinese demand. But its infrastructure is ailing and a coronavirus outbreak could have a devastating impact.
Asset Class Scores
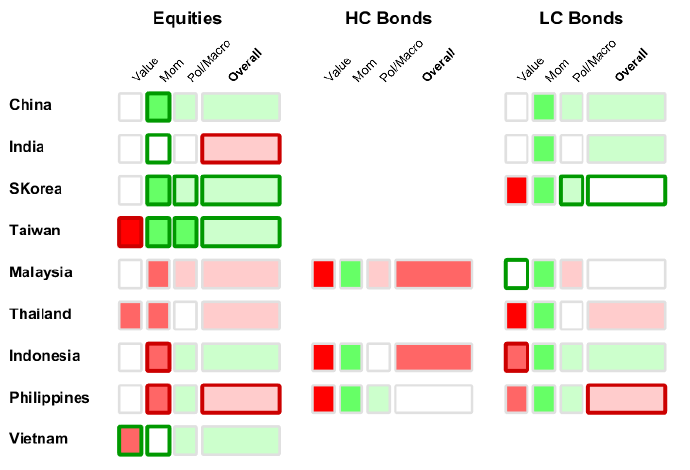
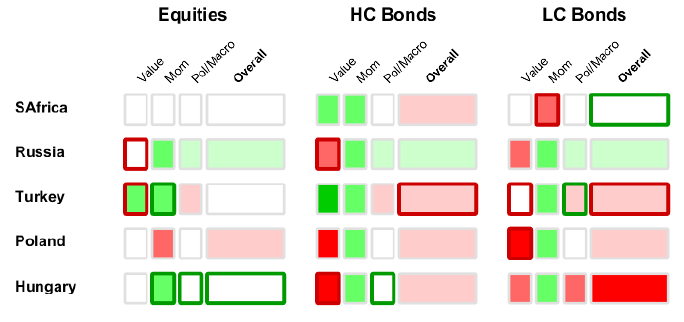
Score Summary: For each country and asset class, scores are represented by colours – white is neutral, green is positive and red is negative. The overall score is shown to the right with the underlying scores – value, momentum and political/macro – shown to the left. The border shows grey for no score change, while green shows positive and red negative.
The asset classes mentioned herein are a reflection of the portfolio manager’s current view of the investment strategies taken on behalf of the portfolio managed. These comments should not be constituted as an investment research or recommendation advice. Any prediction, projection or forecast on sectors, the economy and/or the market trends is not necessarily indicative of their future state or likely performances.
Recovery in (quality) demand from China
Throughout 2019, many believed that more stimulus was required to get Chinese demand back on track, but the authorities stuck to the script. The government refrained from enacting a large credit-induced recovery and instead kept with a reform agenda, much of which was designed to induce private sector demand rather than address typical channels of misallocations to infrastructure or property.
The government is still investing. However, it is now opting for computers and communications over bricks and mortar sectors, which is all the more important in the wake of US threats to pull supplies from companies such as Huawei. In October, Beijing unveiled a second massive state-backed fund for semiconductors, raising USD 29 billion. China now produces 5% of the global semiconductor supply, up from virtually zero just a year ago.
China’s ambitions in technology coupled with the impending 5G rollout have given a healthy boost to the hardware cycle. Of course, the extent of the supply chain disruption caused by the coronavirus outbreak is difficult to gauge at this stage. Amid the outbreak, though, some live broadcasts from hospitals have inadvertently raised the profile of 5G among the public eager for news on the coronavirus. Furthermore, Taiwan and South Korea are still well-positioned to benefit from the 5G rollout.
Chart 2: Technology hardware cycle recovery
Source: Bloomberg, January 2020
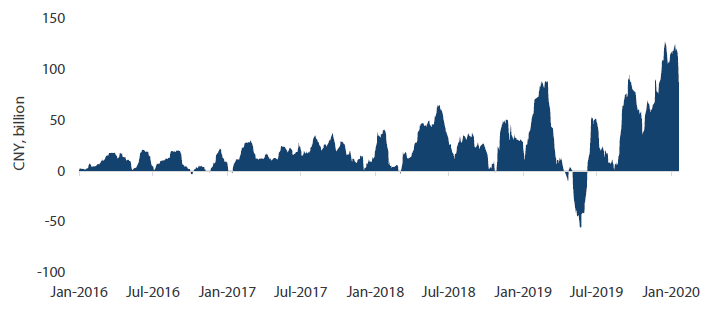
Earnings prospects are quite good for China’s tech, software and consumption sectors. For the near term, however, consumption could be confined mostly to online sales due to the coronavirus outbreak. Meanwhile, MSCI continues to raise the weighting of China’s A-shares within its indexes, lifting the inclusion factor from 15% to 20% in late November. Investors remain significantly underweight A-shares, though northbound flows from Hong Kong to China continue to rise.
Chart 3: Northbound flows (20-day moving average) accelerate with coronavirus downtick
Source: Bloomberg, January 2020
India inflation surprise and fiscal woes
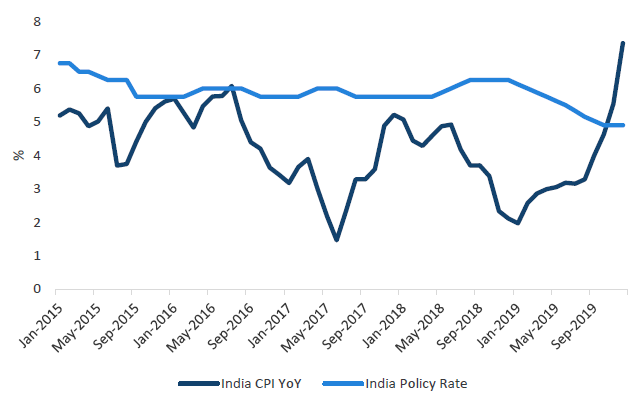
India’s consumer price index (CPI) jumped to 7.35% in December, up from just over 2% at the beginning of the year, attributable mainly to the rise in food prices (and more specifically onions). The central bank is now on hold, adding to bond volatility since early December. To a large extent, food-driven price inflation is likely to be temporary with future harvests expected to normalise supply.
While inflation pressures may dissipate, fiscal slippage is perhaps a more important factor that keeps yields elevated. The fiscal deficit was budgeted for 3.3% of GDP after the tax cut back in August; however, most are projecting some degree of slippage bringing the deficit closer to 4%, leaving no room for additional stimulus.
Chart 4: India CPI punches through policy rate
Source: Bloomberg, January 2020
Indian industrial production and purchasing manager’s indices (PMIs) are up marginally on the manufacturing upturn, but investment and consumption remain muted. Weakness, particularly in construction, is hurting rural employment; as a result consumption is expected to remain soft indefinitely. It is difficult to find a silver lining as bank balance sheets are weak and as the authorities do not have much capacity for additional fiscal and monetary stimulus. Yet equities are still priced 21 times 2020 earnings, which is particularly rich given the subdued growth outlook.
EMEA: Mix of vulnerability and strength
Not surprisingly, EMEA currencies have been hit hard by the coronavirus outbreak. The South African rand is performing particularly poorly due to falling Chinese demand for materials and a very challenging fiscal trajectory that a makes a Moody’s downgrade of South Africa seem imminent.
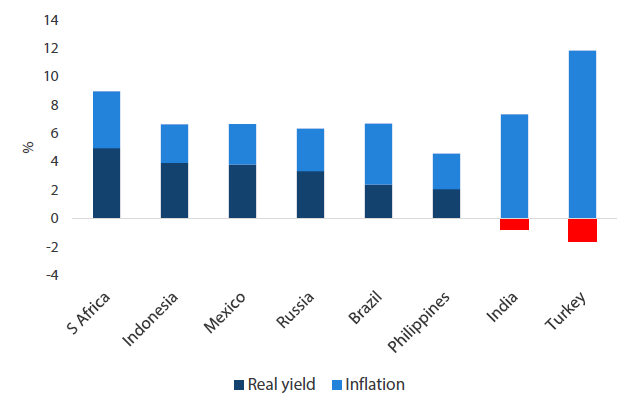
The Turkish lira has been comparatively stable in recent weeks. But it was still the weakest regional currency in 4Q19 as the Turkish central bank continued to cut rates aggressively, essentially removing any real yield buffer. Turkish equities are cheap, leaving some interesting opportunities among quality companies with limited exposure to the macro environment.
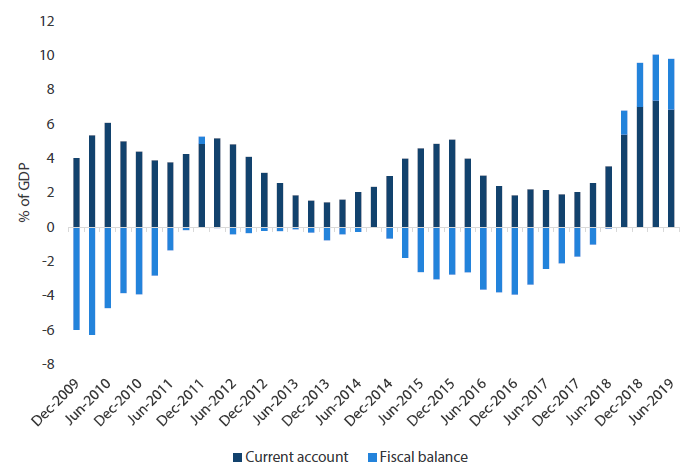
Within EMEA, we still find Russian equities and bonds the most attractive. Growth is improving, but most importantly, Russia’s strong fiscal and current account surpluses make the country much more immune to increasingly wobbly external conditions.
Asset Class Scores
Score Summary: For each country and asset class, scores are represented by colours – white is neutral, green is positive and red is negative. The overall score is shown to the right with the underlying scores – value, momentum and political/macro – shown to the left. The border shows grey for no score change, while green shows positive and red negative.
The asset classes mentioned herein are a reflection of the portfolio manager’s current view of the investment strategies taken on behalf of the portfolio managed. These comments should not be constituted as an investment research or recommendation advice. Any prediction, projection or forecast on sectors, the economy and/or the market trends is not necessarily indicative of their future state or likely performances.
Turkish bonds look vulnerable
The Turkish central bank has cut rates aggressively, from 24% in June 2019 to 11.25% in January 2020. Bond markets responded favourably to the rate cuts with yields compressing for some impressive gains. However, while the Turkish lira initially reacted favourably to the rate cuts, weakness returned in early August, with the currency selling off over 8% into late January.
As Chart 5 shows, Turkey’s real yield buffer disappeared as the country’s CPI accelerated. Inflation rose 11.8% in December and is expected to stay at these levels for some time. Meanwhile, the budget deficit worsened from 2.0% of the GDP in 2018 to 2.8% in 2019. Excluding one-off revenues, the deficit actually stands at 5.0%, highlighting the country’s dire fiscal situation.
Chart 5: Real yields across regions
Source: Bloomberg, January 2020
Turkish assets were downgraded accordingly, but we remain neutral on Turkish equities for specific value opportunities. These include high quality companies that are less exposed to macro deterioration, such as consumer staples.
Russia to stay resilient
Market shocks are never kind to emerging market assets. But under periods of protracted stress, it is the external accounts that distinguish the winners from the losers over the longer term. As shown in Chart 6, Russia has undergone a major structural adjustment and the country currently enjoys significant twin current and fiscal surpluses.
Chart 6: Russian twin surpluses
Source: Bloomberg, January 2020
External debt levels have declined to such an extent that Russia could pay off its debts out of its FX reserves. In other words, Russia is self-sustaining and independent of external funding sources. While the falling price of oil hurts its terms of trade and adds to short-term asset volatility, Russia’s positive external position is a natural long-term stabiliser for its currency and the economy as a whole.
We still like Russian bonds, though the country’s easing cycle has mostly run its course. And despite having been a top performer last year, Russian equities still look cheap: their dividend yields are almost 8% and the most attractive in the world. Between attractive valuations, strong profitability and a decent buyback schedule, we still see potential for Russian equities to re-rate against their peers.
Latin America still vulnerable
The Latin America (LatAm) region suffered multiple shocks in 2019, including major unrest in Chile and disturbances of a lesser scale in Colombia. The region’s economies remained on course to steadily push market-friendly reforms, but rising dissatisfaction and unrest ultimately cancelled out such efforts. The exception was Brazil, where lawmakers still see reforms as the best hope to revive growth and ultimately retain their political positions.
Since 2011, LatAm has perhaps suffered the most out of emerging markets, adjusting to weaker external demand—particularly from China—and much lower commodity prices. The coronavirus scare certainly has not helped matters, freezing trade and causing a further tumble in commodity prices.
Outside Mexico and Peru, LatAm currencies have remained weak throughout 2019. The Brazilian real, for example, weakened although the government enacted major reforms throughout the year. Brazil actually looks poised to eventually benefit from reforms amid evidence that growth is finally improving. However, LatAm as a whole is particularly vulnerable to external shocks as growth remains muted across the region due to still-shaky politics.
Asset Class Scores
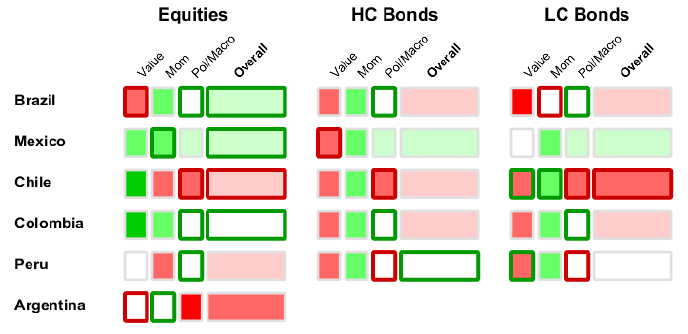
Score Summary: For each country and asset class, scores are represented by colours – white is neutral, green is positive and red is negative. The overall score is shown to the right with the underlying scores – value, momentum and political/macro – shown to the left. The border shows grey for no score change, while green shows positive and red negative.
The asset classes mentioned herein are a reflection of the portfolio manager’s current view of the investment strategies taken on behalf of the portfolio managed. These comments should not be constituted as an investment research or recommendation advice. Any prediction, projection or forecast on sectors, the economy and/or the market trends is not necessarily indicative of their future state or likely performances.
LatAm still sensitive to global demand
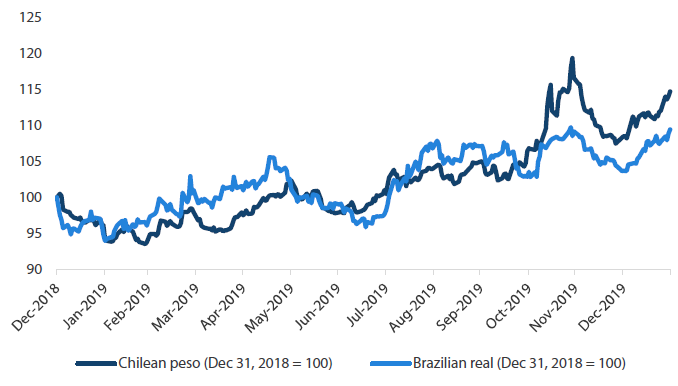
In 4Q 2019, global markets generally grew more sanguine on an impending phase one US-China trade deal, evidence of returning growth and ample central bank liquidity. The sell-off in LatAm currencies continued nevertheless, partially driven by escalating political risk in Chile. Surprisingly, the Chilean peso’s decline was followed closely by the Brazilian real, which fell although Brazil succeeded in pushing its reform agenda forward.
Chart 7: Chilean peso sells off, Brazilian real not far behind
Source: Bloomberg, January 2020
Both the Chilean and Brazilian central banks intervened in late November to shore up their currencies. The currency market interventions seemed to do the trick at least until early 2020 before the sell-off resumed. Chile and Brazil still have the firepower to fight this market rout, but their currency outlook remains challenging. The coronavirus poses a shock to global demand, and further external weakness has the potential to worsen social unrest at home.


