Snapshot
The otherwise promising growth outlook is once again being challenged, this time by the fast spread of the coronavirus. Though appearing not as lethal as SARS back in 2003, the animal-sourced virus has spread more quickly. However, there is some early evidence of new cases slowing down, which could suggest the market bottom is behind us, provided this trend continues.
The virus is spreading relatively slowly outside of China with a fatality rate of just 0.2% (versus 0.1% for the common flu), compared to 2.1% in mainland China. The strong reaction to contain the virus seems to have worked so far, which is encouraging. But given that a cure is yet to be found for the novel virus that still possesses many unknown characteristics, it is too early to say that the worst is over. We thus continue to monitor the situation quite closely.
The question for the markets is what is the extent of economic impact? Clearly, in China, the near-term impact will be substantial, but for the most part lost demand should recover after the worst of the crisis is over, much as it did after SARS. Outside of China, tourism will obviously take hits throughout Asia.
Given that China is at the centre of the global supply chain, the closing of its borders and the shutdown of its cities will have a further-reaching impact, again mainly in Asia but also across the global supply chain. A short-term shutdown is easily absorbed —call it an extended Lunar New Year holiday—but if the shutdown is more protracted, the damage will reverberate into other parts of the global economy that could be more lasting. In this respect, the return of workers to factories in the coming days/weeks would be an important signpost.
The People’s Bank of China (PBOC) quickly cut rates and injected significant liquidity into the system while markets anticipate further easing by the US Federal Reserve (Fed). Perversely, US equity markets were more moved by the potential for further easing than the actual threat of the virus. This may be a reasonable conclusion if the virus stays contained and the supply chain disruption is not protracted.
Similar to last year when equity and bond markets diverged so significantly, equities have once again rebounded to new highs while bond yields have lifted from the initial shock, but only moderately so. Oil prices are still lower by about 16% since the outbreak and copper is down about 8%. China has increased stimulus, but so far, there are no indications of any significant credit binge that would lift the commodity complex more broadly. Near-term demand will clearly suffer, so it is not a surprise to see prices come off as much as they have. Demand and prices should ultimately rebound, the question being when.
Asset class hierarchy (team view1)

* Average scores for Equity, Sovereign and Credit are weighted average scores, which are computed using market cap weights.
1The asset classes or sectors mentioned herein are a reflection of the portfolio manager’s current view of the investment strategies taken on behalf of the portfolio managed. These comments should not be constituted as an investment research or recommendation advice. Any prediction, projection or forecast on sectors, the economy and/or the market trends is not necessarily indicative of their future state or likely performances.
Research Views
We adjust our asset class views and hierarchies as discussed below.
Global equities
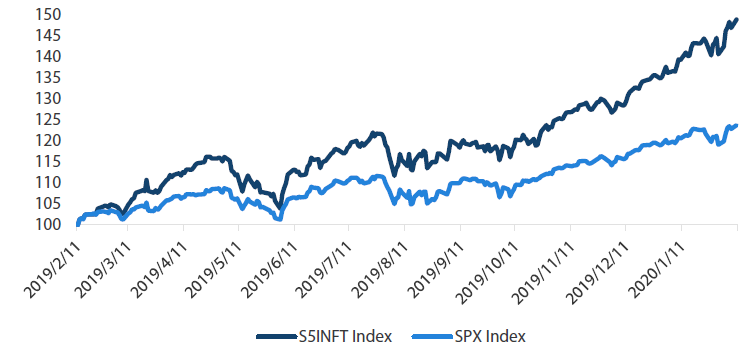
US equities are once again proving to be relatively impervious to market shocks, the coronavirus causing barely a pause before markets reached new highs. While most markets have bounced on the hope that the number of new cases may be losing steam while central banks continue to lend support, none have reached new highs and recovered as quickly as US equities. Once again, the technology sector is driving the outperformance–up nearly 50% over the last 12 months versus 23% for the broad market.
Chart 1: S&P Tech (S5INFT) versus S&P 500 (SPX)
Source: Bloomberg, January 2020
Last year, the rotation from growth to value in the midst of an economic recovery proved to be short-lived. With bond yields once again compressed, the allure of superior long-term earnings growth once again trumps the attractiveness of meagre yields in low growth instruments.
The current environment shares similar characteristics to the late 1990s when the US cut rates to buffer contagion from the Asian financial crisis. This simply fuelled the last drive of a speculative tech bubble, followed shortly by a bust when the Fed finally took the proverbial punchbowl away.
The major difference today is that technology companies produce real earnings and strong cash flows, while the dot-com era was more about selling a cash-burning idea–not unlike WeWork where dream-selling unicorns found their comeuppance just last year.
We expect the S&P technology earnings to grow a respectable 8%, built on secular themes within cloud computing and software-as-a-service continuing to drive momentum in the software sector. Semiconductors have suffered from weak demand, a trend that was beginning to turn around but now looks vulnerable given the shock to the supply chain caused by the coronavirus outbreak.
This shock to the supply chain is a clear watch point, but the flipside of these stresses is a still-easy Fed that is willing to keep rates low and liquidity ample to buffer any shock. In effect, the US can benefit from easy policy while not feeling nearly the economic impact that Asia could experience–such as in the late 1990s when easy rates extended “irrational exuberance” for several more years before the Fed finally reversed its position. So far, the Fed appears to be on the market’s side.
Global bonds
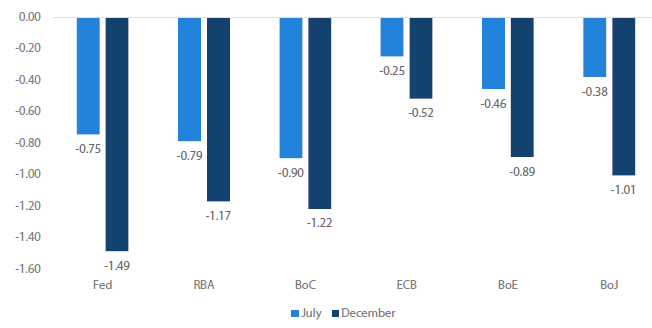
Our expectations for an improving global economic outlook in 2020 have suffered an early setback from the outbreak of the coronavirus. Whereas improving global growth would put pressure on market expectations of central bank easing, a weaker outlook increases easing expectations and weighs on bond yields. Chart 2 shows the market’s expectations for the number of central bank monetary policy changes that could take place by July 2020 and December 2020. These expectations are based on market derivative pricing and one central bank rate move is assumed at 25 basis points (bps) with the exception of 10 bps for the Bank of Japan and the European Central Bank.
Chart 2: Estimated number of central bank rate moves by July 2020 and December 2020
Source: Bloomberg, February 2020
All of the dollar-bloc central banks are expected to ease policy at least once in 2020. Pricing for the Fed is the most aggressive as expectations go beyond one easing to a 49% chance of a second easing. The Bank of Canada (BOC) and the Reserve Bank of Australia (RBA) are also seen delivering more than one easing with probabilities of 21% and 17%, respectively. These expectations have moved markedly since the beginning of the year as the spread of the coronavirus has shaken the market’s confidence in a global recovery. Market pricing for the Fed indicated only a 70% chance of just one easing in 2020 and a less than 20% chance for the BOC. RBA pricing has been more stable but has also increased from less than one easing to more than one. Expectations are more muted for those central banks where official cash rates are already very low or negative. Whether these monetary policy easing expectations are realised will likely be determined by how deep the virus-related growth slowdown becomes and how well the global economy bounces back in the aftermath.
Global credit
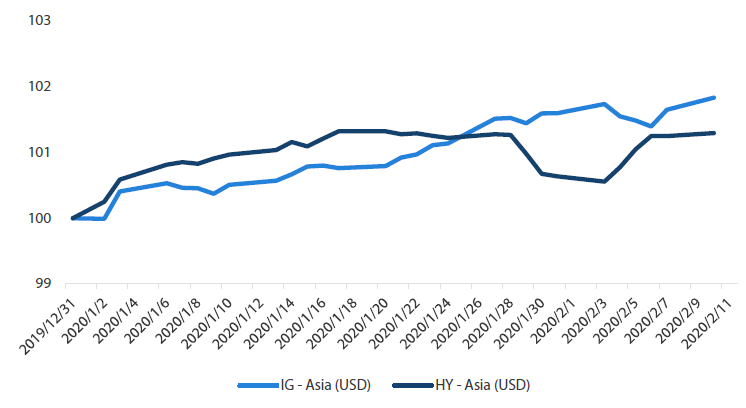
Global credit started the year with strong returns, supported by expectations for improvements in the global economic and trade outlook. Chart 3 shows the total return for Asian investment grade and high yield credit in US dollar terms. High yield in particular was performing strongly on the back of reduced US-China trade tensions. However, this enthusiasm was quickly curtailed as news of the coronavirus took centre stage late in January. Within Asian high yield, the Chinese property sector was hit particularly hard as authorities took aggressive quarantine actions to control the spread of the virus.
Adding to the uncertainty for risk assets in Asia was the extended closure of Chinese equities trading. When the markets finally reopened, strong selling hit China’s stock markets. While this was expected, the PBOC was quick to inject liquidity and cut short-term funding rates. This support provided much-needed confidence that Asian high yield issuers would not suddenly become liquidity constrained, allowing returns to rebound strongly. Nevertheless, caution is still evident in Asia’s credit markets as safer investment grade returns have moved ahead of high yield returns.
Chart 3: Asian (USD) Investment Grade and High Yield returns (YTD indexed to 100)
Source: ICE Bank of America and Bloomberg Barclays Indices, Bloomberg, February 2020
FX
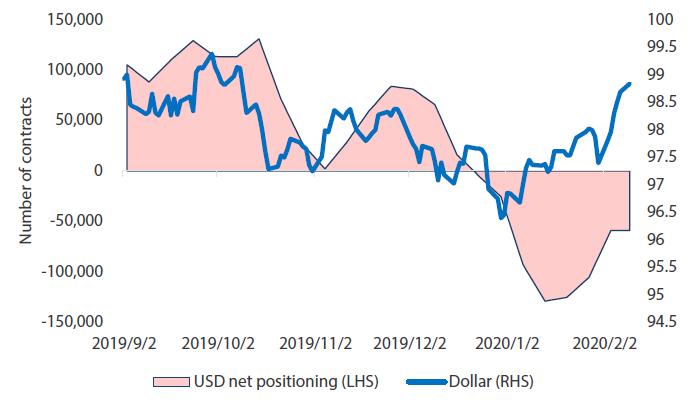
Early in the year, we were not alone in believing that the dollar looked set to weaken on the back of the signing of the US-China “Phase One” trade deal, improving growth around the world and ample central bank liquidity. However, not surprisingly, the sudden uncertainty presented by the coronavirus outbreak once again sent flows back to the perceived safety of the greenback. As shown in Chart 4, while net positioning had been leaning short into the beginning of the year, flows saw a sharp reversal since mid-January.
Chart 4: USD net positioning versus DXY Index
Source: Bloomberg, January 2020
This reversal of flows may be sensible insofar as the virus is clearly a setback for growth in China and more broadly, Asia. However, while most Asian currencies sold off, the relative stability of the Chinese Renminbi is noteworthy. Unlike the ongoing trade war when the Renminbi proved to be quite volatile, current stability suggests a lesser, or at least only temporary, economic setback to economic growth. Our base case is still that growth improves around the world, but uncertainty concerning the coronavirus will certainly continue to add to volatility over the near term.
Commodities
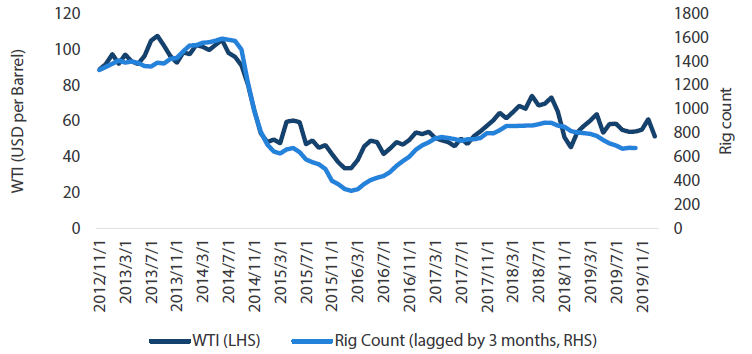
The Lunar New Year is typically the busiest time of the year for Chinese to travel, within the mainland and across the region. Instead, between locked-down cities and other measures to prevent the spread of the coronavirus, transportation fell to a fraction of normal flows. Given the demand shock, it was not surprising to see the West Texas Intermediate (WTI) crude oil price fall as much as it did, dropping 15% from mid-January. Our base case is that this price action is temporary as demand recovers in the months ahead. However, if the slowdown is more protracted, there is risk of further downside.
On the supply side, OPEC is worried and ready to cut production further and for longer. Russia is showing some reluctance to participate; however, it will be compelled to join if the supply glut continues to build. US shale producers could also cut production as price falls are often linked to declines in the rig count.
Chart 5: Rig count vs WTI
Source: Bloomberg, Baker Hughes, February 2020
REITs and infrastructure
As bond yields have compressed, flows have once again returned to REITs and infrastructure, both of which offer an attractive yield. Like REITs that pay healthy dividends generated from underlying real estate assets, infrastructure pays dividends generated from a broad range of real assets which support societal infrastructure, ranging from transportation and energy to water distribution and telecom networks. These assets share the characteristic of paying healthy dividends, which remains steady throughout the cycle.
Infrastructure projects are funded publicly, privately or via public-private partnerships (PPP). Some infrastructure assets (e.g. Sydney airport and Bangkok Expressway) are listed and traded in the stock market. There are also publicly listed infrastructure funds, which manage a wide range of infrastructure assets across geographies.
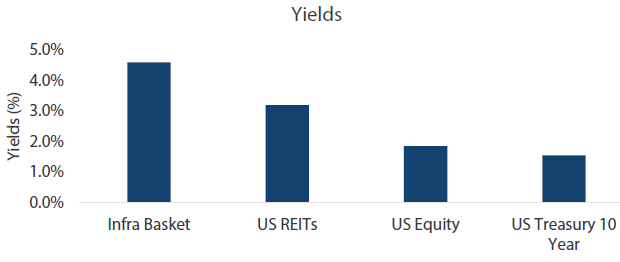
We invest in infrastructure via a basket of high quality, publicly listed infrastructure funds, offering diversification across asset types and geographies. As shown in Chart 6, the infrastructure basket yields 4.5% per annum in USD, which is quite healthy compared to other yield alternatives.
Chart 6: Asset class yields comparison
Source: Bloomberg, February 2020
Infrastructure does have equity-like risk characteristics as it is publicly traded. Over the medium- to long-term, however, it offers healthy diversification in a portfolio context. While equity performance is clearly dependent on the health of the economic cycle, infrastructure depends very little on such a cycle and is perhaps less cyclical compared to rental income-dependent REITs.
Tactically, we will allocate more to REITs and infrastructure when the economic environment appears more challenging. Until recently, we were more bullish on the economic outlook for equities, but REITs and infrastructure once again look attractive based on elevated uncertainty and the relative attractiveness compared to bond yields, which are again compressed.
Process
