Summary
How did we get here?
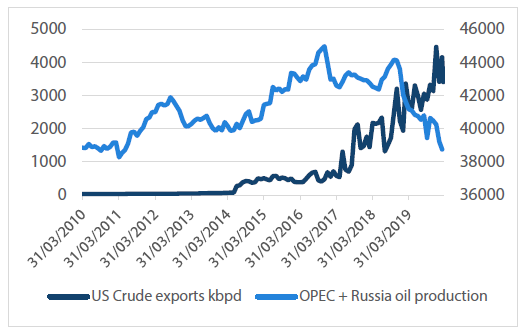
Historically, OPEC’s role was to coordinate and unify petroleum policies of its Member Countries to ensure the stabilisation of oil markets and provide income stability for member producers. Given its position as the world’s second largest exporter (next to Saudi Arabia), in 2016 Russia was brought on board to provide further clout to the organisation. This was after failing to join in cuts in 2014, which led to the last oil price collapse. Russia continues to be a participant in OPEC+, which has provided price stability for the world’s producers. During the same period, US production growth surged, particularly from its unconventional shale basins, which has allowed the US to become energy self-sufficient and a net exporter of crude and petroleum products.
One could argue this energy independence was gained at the cost of, or at least with the assistance of, OPEC+ market share and revenues. In our view, it appears Russia’s decision not to participate in further cuts is at least, in part, aimed at ensuring the US producers share the role of delivering market balance. When combined with a number of high profile Russian individuals and entities being the subject of a number of US sanctions, Russia’s actions could also be designed to gain some political leverage to push for a lifting of sanctions.
Chart 1 OPEC+ production vs oil price
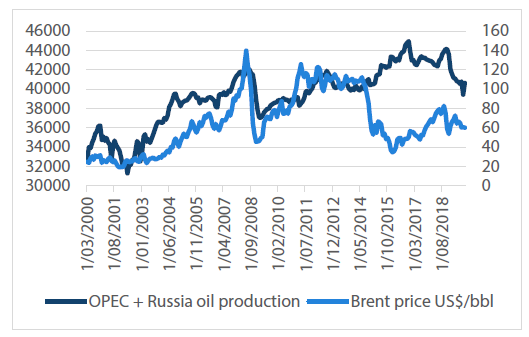
Chart 2 OPEC+ production vs US oil exports
Source: Bloomberg, Nikko AM
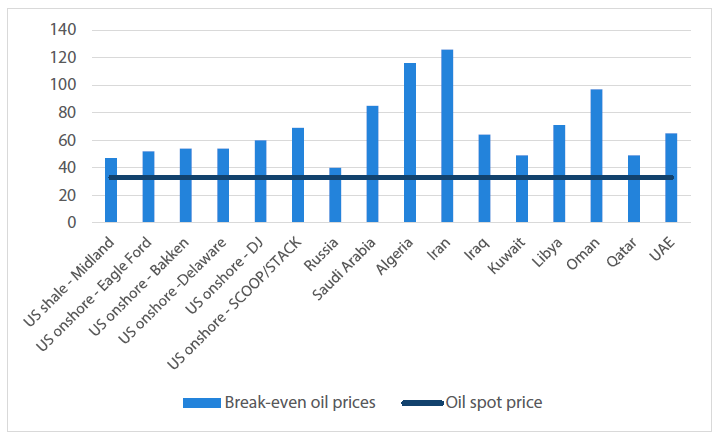
From a high level, and without fully understanding the minutiae of modern geopolitics, one could understand Russia’s goals here. What is more difficult to understand is Saudi Arabia’s aggressive intention to reverse OPEC’s set course and lift production. Saudi Arabia, and indeed many of its OPEC partners, requires significantly higher oil prices to ensure balanced budgets (fiscal break-evens) than Russia. While Russia is likely to be uncomfortable at current oil prices, with a fiscal break-even of $40 – 50/bbl, the Saudi’s could be burning through over US$120bn/yr (~15% of GDP) of its reserves given the IMF estimates its fiscal break-even is in excess of US$80/bbl. The US shale break-even varies between oil fields, but within the Permian — the source of much of recent growth — it is around US$45/bbl (Midland) to US$50/bbl (Delaware).
Chart 3 Break-even oil prices vs SPOT
Source: Bloomberg, IMF, Nikko AM
It is very difficult to know how the current situation will play out, but we do see three possible near-term scenarios:
- OPEC+ reconvenes and agrees to maintain the previous level of cuts. This could ease the current fear of significant oversupply, with renewed confidence that at least 2mbpd would stay out of the market during the uncertain period of COVID-19 induced demand weakness. No doubt the broader market would remain skeptical of compliance and closely monitor OPEC+ output.
- OPEC+ reconvenes and agrees to the extended cuts. In our view, this is an optimistic scenario in light of current circumstances. We doubt Russia’s intent was to see oil fall to current levels, but rather avoid artificial oil price strength given US shale growth was set to slow over 2020. A number of broker analysts suggest 2020 exit growth rates could be around 0.6 to 1mbpd vs the 1.2mbpd growth seen over 2019. Note: this was before the collapse in oil.
- Russia and Saudi Arabia follow through on threats to lift production. Under this scenario, we believe oil prices would remain under significant pressure for an extended period of time and that it’s likely we would see a material reduction in output from the US — either voluntarily or through bankruptcy. The US onshore oil industry has US$40bn in debt falling due in 2020, and $200bn over the next four years. Macquarie Research estimates that at US$35/bbl Brent, the US onshore rig count would fall from ~700 to 300. This would result in zero growth from US onshore, which should reduce global supply by around 0.6-1mbpd; offsetting a substantial portion of the predicted 1.5mbpd demand lost due to COVID-19.
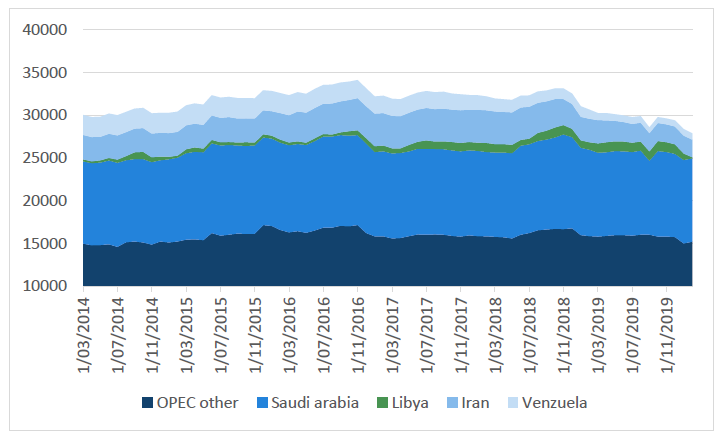
While the supply/demand situation currently looks dire, we should still be cognisant that Libya and Iran are both constrained to the tune of ~3mbpd with no clear path to resuming normal exports — a fact that appears to have been lost given the attention on the larger OPEC+ players.
Chart 4 OPEC production
Source: Bloomberg
Over the long-term, we believe there are a number of factors to warrant higher oil prices:
- Global decline rates ex-US shale have stabilised at ~5%, but the growing contribution of unconventional volumes to the world’s oil mix will likely see aggregate decline rates move higher if investment in shale is muted, and existing shale production is allowed to decline without replacement.
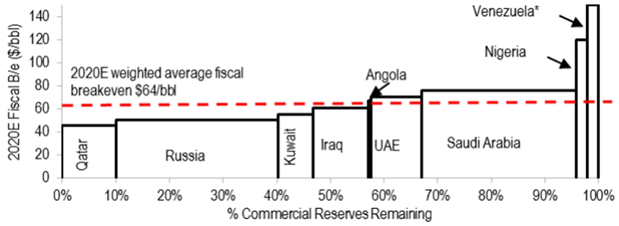
- OPEC fiscal breakevens imply an average US$64/bbl, as shown in Chart 5. Clearly Saudi Arabia, along with Nigeria and Venezuela, are the swing producers, and while the Saudis are clearly not behaving in this fashion at present, over the long-term the country may need to return to its market stabilisation policies to remain profitable.
Chart 5 Updated 2020 fiscal breakevens for selected OPEC+ members – 2020E weighted average $64/bbl vs spot Brent at c$55/bbl
Source: J.P. Morgan estimates, IMF Data
- New projects need higher prices to warrant investment: at spot prices almost all new projects assessed by J.P. Morgan are out of the money. Prices of ~US$60/bbl are needed to bring 50% of these projects on line to replace decline.
Chart 6 Global projects cost curve (15% IRR): ~50% projects breakeven on the current strip

Source: J.P. Morgan estimates, Company data
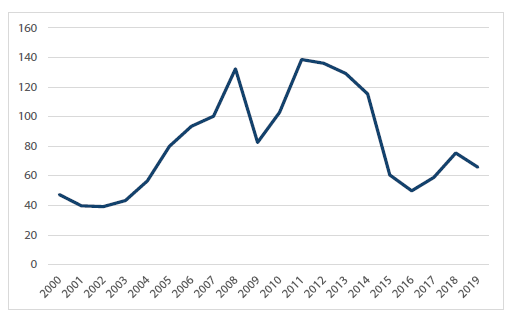
- While economic conditions have changed over this time period, it’s worth noting the oil price has averaged ~US$82/bbl in 2020 real terms over the past 20 years.
Chart 7 2020 real oil price
Source: Bloomberg, MST Marquee
Conclusion
The collapse of the agreements by OPEC+ has placed us in a situation very few had expected. Prior to the events of the week commencing 2 March, broker consensus was that oil prices were roughly flat at US$60/bbl over the medium term. Our investment time horizon is more long-term in nature, but for comfort we frequently review balance sheet strength under a number of downside scenarios to ensure there are ample buffers to protect against periods of commodity price weakness.
The largest decline in oil price since the 1991 Gulf War has caught us, and the market, by surprise. Oil Search is the most levered of the larger oil names, and has therefore seen the brunt of the market’s selling pressure. We believe the balance sheet risks can be managed in the near-term. The market is heavily discounting the value of its share of the foundation PNG LNG project, and ascribing no value whatsoever to expansion opportunities.
The market appears to have entered a period of panic selling, but we expect to see a number of value opportunities arise in the aftermath. As Warren Buffet once said, “Be greedy when others are fearful.”
Important Information
This material was prepared and is issued by Nikko AM Limited ABN 99 003 376 252 AFSL No: 237563 (Nikko AM Australia). Nikko AM Australia is part of the Nikko AM Group. The information contained in this material is of a general nature only and does not constitute personal advice, nor does it constitute an offer of any financial product. It is for the use of researchers, licensed financial advisers and their authorised representatives, and does not take into account the objectives, financial situation or needs of any individual. The information in this material has been prepared from what is considered to be reliable information, but the accuracy and integrity of the information is not guaranteed. Figures, charts, opinions and other data, including statistics, in this material are current as at the date of publication, unless stated otherwise. The graphs and figures contained in this material include either past or backdated data, and make no promise of future investment returns. Past performance is not an indicator of future performance. Any economic or market forecasts are not guaranteed. Any references to particular securities or sectors are for illustrative purposes only and are as at the date of publication of this material. This is not a recommendation in relation to any named securities or sectors and no warranty or guarantee is provided.


