Summary
As mortgage relief measures and offers of repayment holidays continue to make headlines across Australia, concern is rising about what impact this will have on the RMBS market. But RMBS are often maligned as being riskier than facts would suggest. Here we examine AAA senior notes and explain why RMBS remains an attractive investment during times of volatility.
Liquidity: Most RMBS transactions will have a liquidity reserve that is designed to capture excess income of the structure for a ‘rainy day’. Standard & Poor’s (S&P) tells us that the average prime RMBS transaction could withstand on average 9 to 12 months of no payments before the reserve would run dry. (Note: these differ by transaction). In the event liquidity runs out, we revert to the payment waterfall. In these waterfalls, the AAA senior notes get repaid any interest before any other note. As long as some cash flow is coming into the trust there will be income to pay investors (we are not assuming everyone in Australia defaults).
Default frequency: The AAA assumptions assume that 10% of an average mortgage pool defaults when calculating how much subordination a transaction requires. This assumption is higher than anything Australia has seen in the past 30 years and is 2x above the ~5% default frequency that was seen in the US during the Global Financial Crisis (GFC).
Housing decline assumption The AAA assumptions assumes house prices fall 45% when calculating how much subordination a transaction requires. During the GFC, US house prices fell a little under 30%. To put this into perspective, house prices in Australia would need to fall to 2005 levels — a time when cash rates where above 5% and the average wage was $1,000 (compared to $1,600 now).
When looking at RMBS, rating agencies are assessing the degree of loss that a transaction could withstand. While they make all sorts of adjustments, the majority of their analysis comes down to two things:
- How many borrowers will default?
- How much will they lose when they do?
Before we explore these questions in more detail, it’s important that we first look at liquidity, as the current environment raises the question of how long can we survive? With this in mind it’s important to lay out what the S&P assumptions are trying to achieve, which is that AAA transactions should only fall over in Great Depression-like conditions. So, some of the assumptions are likely wider than you expect, but that is the point.
“The criteria calibration begins with anchoring the ‘AAA’ credit enhancement for an archetypical pool of loans, reflecting anticipated losses under a Great Depression-like economic stress.”
—Australian RMBS Rating Methodology and Assumptions, S&P Global Ratings, September 1, 2011
Note: This rating methodology applies generally and each transaction can have nuances that deviate from this. So our comments and analysis will be at the sector level, focusing only on AAA-rated pieces as that is what we invest in.
1. Liquidity
The first place to start is liquidity because when you think about surviving Great Depression-like conditions, a trust should not fall over if, for whatever unforeseen reason, it does not receive cash flows for one month. This means that most RMBS transactions have a liquidity reserve that builds up over time.
If you think about RMBS, a bank packages up mortgages that investors then purchase and when the mortgage holder pays their interest, it is then passed on to the investors via the RMBS. Currently, the risk is that because a large percentage of the population is not working, the RMBS structures will not receive enough payments to pass on to the bond holders.
Coming back to the liquidity reserve, RMBS transactions will typically have a mechanism that builds up cash over time and which is made available during times of stress. An example of how this works is shown below.
What happens in this deal is that the trust will capture $5m of spread into a liquidity reserve, which can be used in challenging times like we are witnessing today. The excess spread is the difference between the mortgage rate (for example 3.5%) and the amount paid to investors (let’s say the average RMBS coupon payable is 3%). While the reserve is less than $5m dollars, any spread above the RMBS coupon rates will be added to the reserve. Once the reserve exceeds $5m, the excess spread can start flowing to wherever the waterfall structure dictates, including being distributed to the equity owner of the trust. This liquidity reserve then sits dormant until the deal repays, at which point it goes back to the equity holders of the trust.
Here is what S&P said about these provisions:
Essentially, S&P is saying that most Australian RMBS transactions can fund 9 to 12 months of coupons before they come under stress, even with zero cash flows. Each transaction will have different versions of the above mechanism, but some level of spread should be captured to cover a rainy day. The transactions that have been around for longer (called seasoned) will have built up good buffers in them, which is why older deals can become more solid through time.
Note: The liquidity buffers can differ by transaction, as is evidence by S&P’s comments about rating risk:
So, what happens if the liquidity reserve runs out?
If the liquidity reserve runs out, the transactions will fall back onto their contractually agreed payment terms. In the RMBS cash flow waterfalls — the order in which money is paid out — the AAA rated senior notes will receive any interest payments first, followed by the next most senior note until all bond holders have been paid. If there is not enough cash flow to pay all bond holders, the senior notes will be repaid first from the cash flows that do make it to the trust. As long as a certain percentage of the pool can make payment, the AAA rated notes will still receive cash flows.
This same process applies for any principal repayments. In good times, almost all transactions will switch to paying principal repayments on a pari passu basis (i.e. spread across all the available tranches), provided certain criteria has been met. This criteria is deal specific, but will include things such as 60-day arrears cannot be above 4%, there can be no charge-offs on any notes and total subordination must be above x%. This means should the liquidity reserve run out, one of these conditions will likely be triggered. Hence sending the deal back to amortise sequentially and putting the AAA notes first in line to receive their principal back. Although we do note that currently loan deferrals are not being treated as arrears, so deal specific triggers will be important.
Given we would now be talking about a stressed environment, we should turn to the assumptions made in these transactions to determine whether the AAA rated notes will get their capital back. As any repayments will be heading to the AAA rated notes first — this gives rise to the two most important aspects listed above:
How many borrowers will default and how much will they lose when they do?
The AAA level assumptions can be seen below and we will look at each aspect separately.
Table 1 Key credit enhancement components for the archetypical pool by rating

*For illustration purposes, loss severity is calculated assuming 5% variable selling costs. A$5,000 fixed selling costs, a metro property of A$100,000 and an interest rate through accrual of 12.76%.
Source: Australian RMBS Rating Methodology and Assumptions, S&P Global Ratings, September 1, 2011
2. Default frequency
As you can see from Table 1, the assumed default frequency (Foreclosure frequency (%)) for the average prime Australian RMBS pool is 10% for AAA rated notes. That is, S&P assumes that 10% of borrowers in any transaction will default and not be able to pay back their loan. When looking at this 10% figure, we need to put that into perspective historically. It’s hard to find a concrete source on Australian default frequencies since they are so low in most periods, but thanks to a number of RBA documents we can look back to the early 1990s recession and the GFC in 2008 to get a feel for how many loans defaulted and couldn’t be repaid.
— Credit Losses at Australian Banks: 1980 – 2013: https://www.rba.gov.au/publications/rdp/2015/pdf/rdp2015-06.pdf
— RBA Chart Pack – March 2020:-https://www.rba.gov.au/chart-pack/pdf/chart-pack.pdf?v=2020-04-01-12-04-06
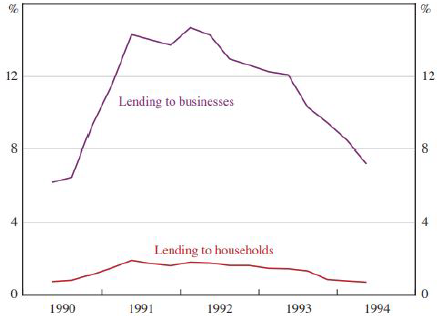
Page 13 of Credit Losses at Australian Banks: 1980 – 2013 shows the non-performing assets by sector in the early 1990s, with lending to households rising to around 2 – 3%.
Chart 1 Figure 6: Non-performing assets by portfolio (all banks, share of lending by type)
Source: RBA
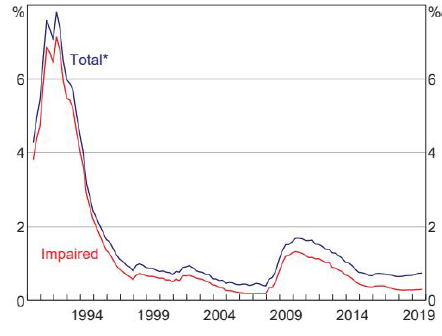
Page 28 of the RBA Chart Pack shows the non-performing loans (not split out by sector), rising to only 2% total over this period. Meaning the household default rate was minimal.
Chart 2 Bank’s non-performing assets (consolidated global operations, share of on-balance sheet assets)
Source: APRA
With respect to the past two crisis we have seen in Australia, the rate of defaults from home owners has not risen anywhere near the AAA assumption of 10%, but rather is sitting in the low single digits.
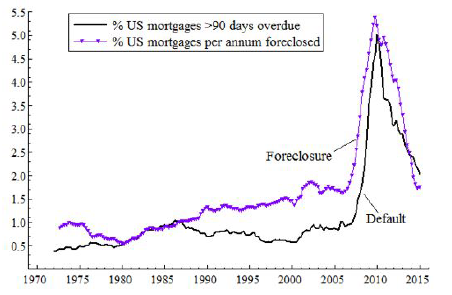
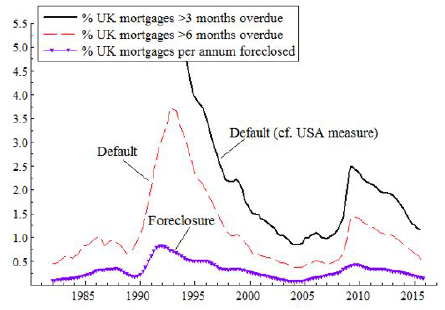
As a quick aside, we can also look at the experience offshore, particularly the US during the GFC and the UK in early 1990s, which saw the rate of default rise to ~5% in both counties , as shown in Charts 3 and 4.
Chart 3 US mortgage foreclosure and payment delinquency rates
Source: https://voxeu.org/article/mortgage-delinquency-and-foreclosure-uk
Chart 4 UK mortgage foreclosure and payment delinquency rates
Source: https://voxeu.org/article/mortgage-delinquency-and-foreclosure-uk
Looking at Charts 3 and 4, we can conclude that an assumption of a 10% default rate is quite high by historical standards. Not just in Australia, but also offshore.
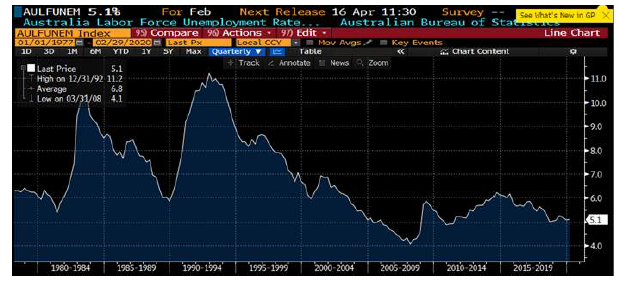
But let’s get a little bit more practical with some back-of-the-envelope calculations. In Australia, about 50% of households are homeowners and if we make the oversimplified assumption that any increase in unemployment here will cause the mortgagee to default on their loan, then we would need unemployment to rise 20% from its current 5% level.
Is this outcome possible? In the current environment we wouldn’t put it outside the realm of possibilities, but we currently don’t believe it’s likely. What we see as being more likely is that unemployment rises towards the 10% range, which is similar to what we’ve seen in previous Australian crisis, as well as the experience in the UK and US. At 10% unemployment, we don’t believe this is high enough to cause a 10% default rate in the housing market.
Chart 5 Australia’s unemployment rate
Source: Bloomberg
In addition, we also need to look at the recent measures introduced by the Federal Government. For households, this includes the recent JobKeeper subsidy that is designed to ensure those who have been stood down from work receive at least $1,500 a fortnight, paid via their employer. From a default frequency perspective, this has two easily identified benefits.
- It likely reduces the number of potential defaults, because the number of employees who would have otherwise had no income will now receive a regular payment. While we wouldn’t suggest that all of the people receiving this subsidy are going to prioritise paying their mortgage over essentials, it should take some of the sting out of the unemployment market.
- When we eventually come out of this economic problem, it will be far easier for people to return to normal. Essentially, the government is allowing firms to keep staff on their books and call them back to work when they are ready. This will prevent firms having to rehire and employees having to search for work, which means when the economy picks up again the dislocation period should be shorter, thus potentially reducing the default frequency.
The experience of Australia in the early 1990s, and both the UK and US in their respective crises, suggest that our default rate for home loans should not rise to 10%, which makes the AAA assumption that 10% of a mortgage pool must default a tough one to break. It is also worth noting that for Australian transactions during the GFC period, securities were all money good (i.e. they will repay on time and not default) even at very subordinated levels (at the time when subordination levels were set much lower). The one caveat we would note, is that Australian household debt is higher than it has ever been in the past 20 years and this could contribute to a poorer outcome than we currently expect.
3. Loss given default
The final assumption that we need to look at is the loss given default. That is, if a person defaults on their loan, how much do we recover from the asset that we become entitled to? At the AAA level, this is made up of two components:
- A reduction in house prices of 45%
- Costs associated with selling the home of 5%.
This provides us with a loss given default (on the asset) of 50%. Let’s take a look at a simple example of how loss is passed to an RMBS transaction. A customer borrows 70% of the value of their house price from the bank to buy a $1m house. Their current position looks like this:
Figure 1 Example lending scenario
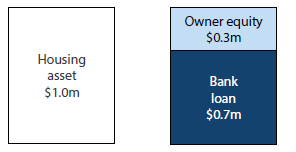
The borrower defaults. Assuming a 50% loss severity on asset, at the time of default this would result in the following outcome:
Figure 2 Example showing write down due to default on loan
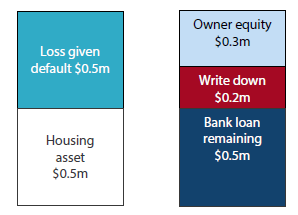
In this scenario, the borrower has lost their $0.3m equity and the bank has suffered a loss of $0.2m on the loan, which they recover from the $0.5m sale of the property. The $0.2m loss is passed to the RMBS transaction. This shows that the larger loss severity that is assumed, the greater the losses that would be passed on to the transaction.
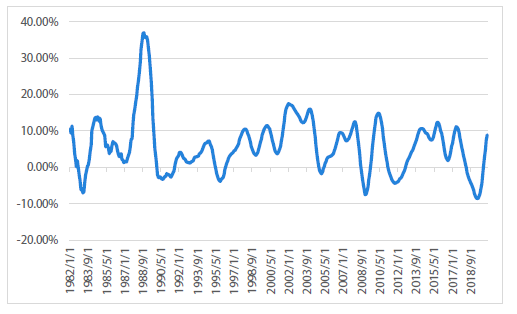
From an Australian perspective, we need to also determine the likelihood of this loss severity occurring. Focusing on the house price decline assumption of 45%, this would land in unchartered territory as over the past 30 years house prices have very rarely declined.
Chart 6 Australian house prices – year-on-year
Source: Bloomberg
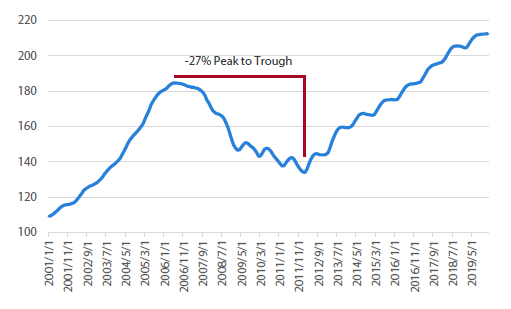
We can also look offshore at the US and UK, to see how their property prices have performed during a crisis. In the US, property prices fell around 30% peak to trough during the subprime mortgage crisis.
Chart 7 US S&P Case Shiller house prices
Source: Bloomberg
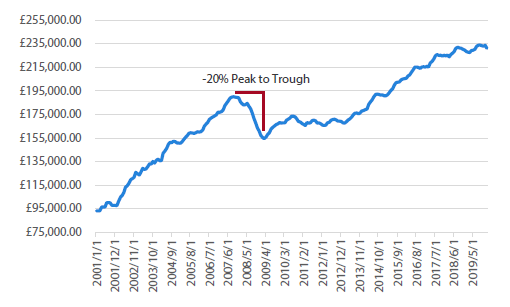
In the UK, during the GFC, house prices fell around 20% peak to trough according to the National Land Registry.
Chart 8 UK house prices
Source: National Land Registry
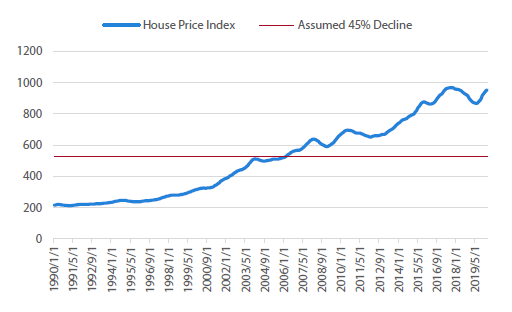
Is this outcome possible? Again, in the current environment it seems appropriate to say there is a chance, but it would be a low one. Chart 9 shows what sort of drawdown a 45% drop in house prices would be from current levels. To put this into perspective it would mean reverting to 2005 prices — a time when the cash rate was over 5% (vs 0.25% now) and the average wage in Australia was around $1,000 per week (vs approximately $1,600 today). The more likely outcome to assume in a protracted downturn would be a 20 – 30% decline, which would be on par with what transpired in the UK and the US. Once again, these numbers are not significant enough to meet the AAA assumptions listed above.
Furthermore this analysis focuses on a drop in current house prices and does not take into account the fact that older transaction (I.e. more seasoned deals) would have been originally analysed from a lower starting point for house prices. For example, on a deal assigned an AAA rating in 2016, these assumptions would have been applied to 2016 house price levels. Over the past four years, not only have house prices risen, but these borrowers would have built up further equity through repayments. As such, for more seasoned deals, the house price decline assumptions will likely need to be larger to stress the AAA subordination.
Chart 9 Australian house price index (1980 = 100)
Source: Bloomberg, Nikko AM
Other factors to consider
The final point to note is that each transaction will be different. The above assumptions are for the “average” mortgage borrower rather than what each individual will look like. This means S&P also makes adjustments on aspects such as whether it’s an investor loan, whether it is in a regional/metro location, the documentation type, etc. All of these adjustments can be found in the Standard and Poor’s methodology and will add additional credit enhancement based on the characteristic of the loan.
These adjustments will push the credit enhancement higher for riskier loans, but will be applied in respect to the above two criteria, which can be thought of as the bedrock of the potential loss analysis. Importantly, when analysing an RMBS portfolio the Loan to Value Ratio (LVR) is going to be extremely important and this occurs due to two reasons:
Firstly, a person that borrows 100% of the asset value compared to 30% is more likely to default, meaning the LVR is a good indicator of the potential default frequency.
Secondly, a person that borrows 100% of the asset value will cause the bank to suffer larger losses should they default than the 30% borrower, as any losses will be passed directly to the bank. As such the LVR is the most important component of calculating the loss given default.
For the above analysis the assumptions use the “archetypical borrower”, which can be thought of as the average borrower pool and assumes a 75% LVR ratio. Adjustments will be made to the credit enhancement required in a RMBS transaction when the LVR ratio is higher or lower than this level.
Conclusion
Since the GFC, the methodology for rating structured finance products has been revised significantly to ensure the AAA rating indeed reflects Great Depression-like stresses. While the current economic outlook is for the economy to slow considerably, we do not yet foresee that the assumptions that sit behind these mortgage-backed securities will be hit at the AAA level.
As such, our expectation is that while the sector could come under pressure due to higher unemployment and slower house prices, this could, depending on how economic conditions progress, lead to downgrades in higher rated notes. However, we believe the securities should remain money good.
Important Information
This material was prepared and is issued by Nikko AM Limited ABN 99 003 376 252 AFSL No: 237563 (Nikko AM Australia). Nikko AM Australia is part of the Nikko AM Group. The information contained in this material is of a general nature only and does not constitute personal advice, nor does it constitute an offer of any financial product. It is for the use of researchers, licensed financial advisers and their authorised representatives, and does not take into account the objectives, financial situation or needs of any individual. The information in this material has been prepared from what is considered to be reliable information, but the accuracy and integrity of the information is not guaranteed. Figures, charts, opinions and other data, including statistics, in this material are current as at the date of publication, unless stated otherwise. The graphs and figures contained in this material include either past or backdated data, and make no promise of future investment returns. Past performance is not an indicator of future performance. Any economic or market forecasts are not guaranteed. Any references to particular securities or sectors are for illustrative purposes only and are as at the date of publication of this material. This is not a recommendation in relation to any named securities or sectors and no warranty or guarantee is provided.


