Snapshot
The velocity of the market downturn was unprecedented in terms of both speed and depth, with the S&P 500 reaching a new high in late February only to fall 34% in about a month. The market managed to recover about a third of these losses into the month-end and as the dust of exceptional market volatility begins to settle, the question is where do we go from here?
While the global outlook remains highly uncertain, the silver lining might just be that the markets repriced quickly to reflect such high levels of uncertainty. After the unprecedented speed of the market decline, valuations are much more attractive than they were just a month ago, and most of the forced selling seems complete.
Meanwhile, heavy monetary and fiscal support came quickly and forcefully, offering at least a partial backstop to the sudden halt in the global economy. However, the key question remains how long this economic pause will need to last to ensure public safety adequately while letting activity resume.
If China is used as a guide, the impact lasts about two months—from the outbreak, to the crippling economic impact of containment, to finally opening back up for business. However, the West was far less prepared and equipped, as exemplified by Italy, where cases and deaths exploded. However, even in Italy, new cases seem to be ebbing and it appears that the US may soon follow with new cases set to decline in the coming weeks.
Our base case is that the recovery resembles more a “U” than the original “V” for which we originally hoped. The number of new cases will likely decline, but it will take time to find the right balance between economic and human safety. Finding the correct balance is likely to drag on through the second quarter, but eventual visibility should release some pent-up demand, allowing the economy to regain its footing. If Covid-19 proves more vicious with repeated waves of outbreaks requiring further economic retrenchment, the outlook becomes more dire, but it is early to make this assessment.
Asset Class Hierarchyy (team view1)
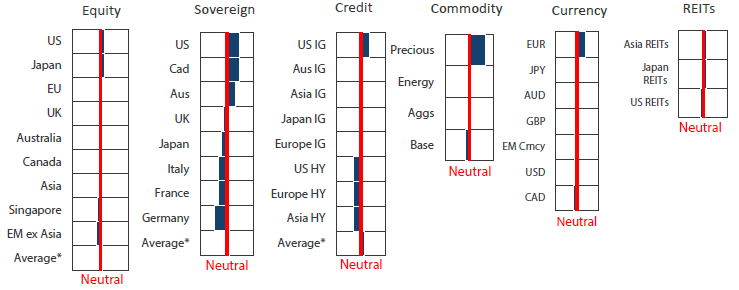
* Average scores for Equity, Sovereign and Credit are weighted average scores, which are computed using market cap weights.
1The asset classes or sectors mentioned herein are a reflection of the portfolio manager’s current view of the investment strategies taken on behalf of the portfolio managed. These comments should not be constituted as an investment research or recommendation advice. Any prediction, projection or forecast on sectors, the economy and/or the market trends is not necessarily indicative of their future state or likely performances.
Research Views
We adjust our asset class views and hierarchies as discussed below.
Global equities
A global shutdown is incredibly daunting from an economic standpoint, and impossible to compare to anything that has occurred in the past, given the depth of the sudden stop that was self-inflicted in efforts to contain the fast moving pandemic. Most collapses in activity have historically followed a bubble burst, requiring misallocated capital to be partially destroyed and the rest redeployed to use that is more productive. Demand slumps during the transition, but ultimately returns as capital and labour are redeployed.
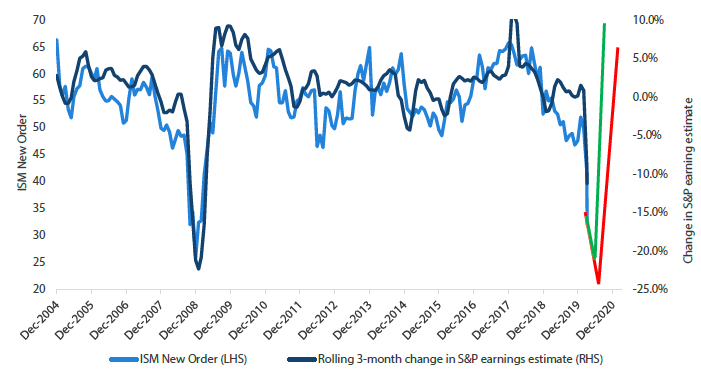
The breath-taking recent fall in equity prices is a direct reflection of the anticipated decline in activity, which drives earnings as shown in Chart 1 below. The biggest question for markets now is how long activity will remain depressed. In the chart, we offer two stylized scenarios: (1) a green V-shaped recovery with activity picking up in June and (2) a red deeper downturn, bottoming in late August approximating the same duration of the Global Financial Crisis (GFC).
Chart 1: ISM new orders versus rolling 3-month change in S&P earnings estimate
Source: Bloomberg, April 2020
The answer to the question of when activity can begin to recover depends on the duration of the lockdown in the US, which is tentatively set for the end of April, pending review. Using China as the benchmark, the return in activity would resemble the green line shown above, but this is likely overly optimistic given the belated efforts toward containment and much wider spread of the virus. Still, it seems reasonable to believe that the US can begin to ease back into activity during the summer months, which would mark a bottom in activity, putting a floor under earnings and asset prices.
Compared to the GFC, the fiscal and monetary response to the Covid-19 pandemic has been much swifter and larger, in effect backstopping lost incomes and credit to help weather the storm. Already, the US Congress is working on a third phase of fiscal stimulus to limit the economic pain. Also unlike the GFC, during which so many lost jobs were only replaced gradually in industries that were more productive, many of the current job losses could be quickly replaced from the same industries in which they were originally lost, in our view.
Given the temporary nature of the slowdown and the strength of the policy response, it seems reasonable to believe that some level of economic normalcy can return during the summer months, putting a bottom under global activity and earnings.
Global bonds
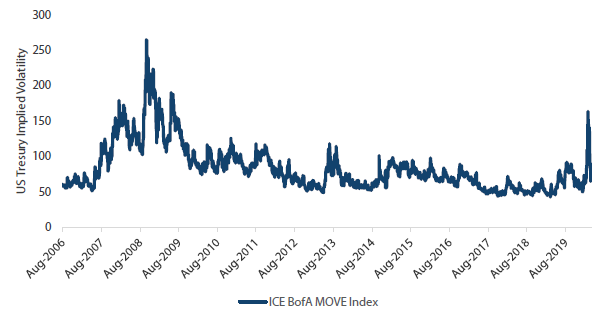
As the Covid-19 pandemic extended beyond Asia to the largest Western economies of the US and the European Union, government bond investors experienced extreme volatility not seen since the GFC. Chart 2 shows the ICE Bank of America MOVE index over the last 14 years. The MOVE index calculates the weighted average implied volatilities of US Treasury (UST) bond options across a number of maturities. Investors use this measure to gauge volatility conditions in bond markets, much as they use the VIX index for equity markets.
Chart 2: US Treasuries volatility index
Source: ICE BofA Indices, Bloomberg, April 2020
The spike in volatility in March 2020 is self-evident in the chart and only surpassed by levels during the GFC. The peak in volatility occurred on 9 March as 10-year UST yields fell over 40 basis points (bps) to an all-time low of 0.31%. Sobering news on the spread of Covid-19 preceded the wild trading conditions amid a rush to safe haven investments. As yields also hit a high point of 1.27% during the month, March saw the largest trading range for 10-year UST yields since November 2008.
The volatility spike however proved relatively short lived as the Federal Reserve (Fed) intervened along with several other central banks to bring some order back to government bond markets. The Fed slashed its Fed Funds target rate by 1.5% in two steps that brought the rate down to its effective lower bound. It also announced it would renew its asset purchase programme to buy UST bonds with no stated size limitation (making it effectively unlimited) to ensure the “smooth functioning” of the market. These measures proved effective in bringing volatility down to more normal levels and calming investors. Looking ahead, the convergence of monetary policies in developed economies to their effective lower bounds and ongoing buying support from quantitative easing will likely keep global bond yields low.
Global credit
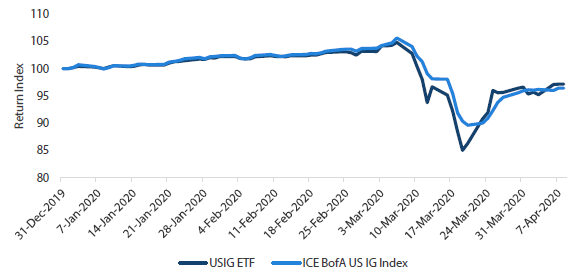
Investment grade (IG) credit markets held up well as global equity markets began to deteriorate in February. As we turned to March, credit spreads were mostly steady through the first week before succumbing to mounting Covid-19 concerns and sharp falls in risk assets. Credit returns fell precipitously from 5% year-to-date to being down 10%, a shocking change of fortunes over a two-week period. Investors in exchange traded funds (ETFs) fared even worse as shown in Chart 3. Lack of liquidity in credit markets made it difficult for IG ETF liquidity providers to maintain parity between ETF prices and their underlying index values. As an example, one of the larger IG ETFs managed by iShares (and shown in the Chart below) exceeded a discount of 5% on multiple occasions.
The Fed once again came to the rescue to meet this stress head on. The introduction of two new programmes would see the central bank intervene in IG markets for the first time to buy corporate bonds in both the primary and secondary markets. These actions had the desired impact as buyers began to return to the market almost immediately and new issuance taps opened again. The worrisome negative valuation gaps that had existed for IG ETFs, a reminder of market dysfunction for many, also disappeared within hours of the Fed announcements.
Chart 3: Relative performance of US Investment Grade ETF and underlying index (YTD indexed to 100)
Source: ICE BofA Indices, Bloomberg, April 2020
FX
As the Covid-19 outbreak spread beyond Asia, the sudden repricing of risk unsurprisingly increased demand for traditional safe haven assets, including USD. As selling pressures mounted, the sell-off became disorderly with liquidity drying up across all asset classes including USTs. The Fed stepped in swiftly and significantly to quell such dislocations, announcing uncapped quantitative easing (QE) expanded to include credit as well as a battery of other measures to ease funding pressures. For now, it appears these measures are working given the decline of volatility and the return of normal cross-market correlations.
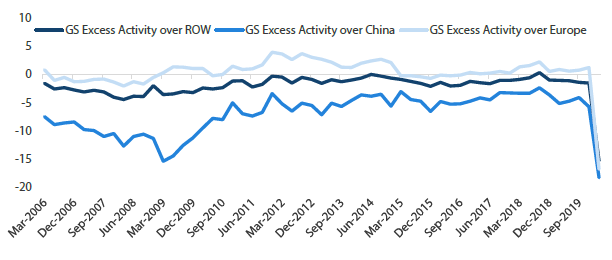
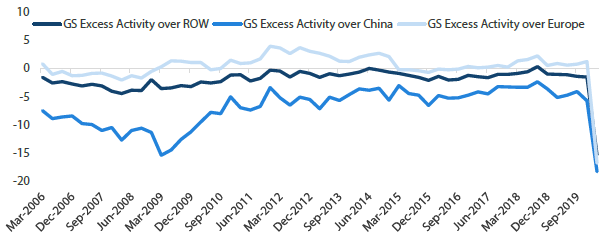
Ongoing uncertainty could still lift USD, adding pressure to global growth. That said, capital ultimately flows to growth opportunities. As shown in chart 4, excess US activity over the rest of the world was on a steady uptrend throughout 2019 into early 2020. But it has since plummeted and the relative impact on activity is far more disruptive than during the GFC. As life in China appears to be returning to normal, economies in the West are still shutdown, only beginning to consider the correct balance between resuming economic activity and containing the virus. Given the pick-up in activity in Asia, and more specifically China, the rotation of better growth outside of the US could support a weaker dollar, on top of the compressed rate differentials (as described last month) and Fed policy to ease dollar funding pressures.
The key risk to this view is a secondary outbreak wave that requires another round of activity suppression as in Singapore. China's approach to managing new cases is a key signpost of its recovery from Covid-19. A prolonged period of significantly slower global demand is another risk to our view.
Chart 4: US excess growth over the rest of the world
Source: Bloomberg, April 2020
Commodities
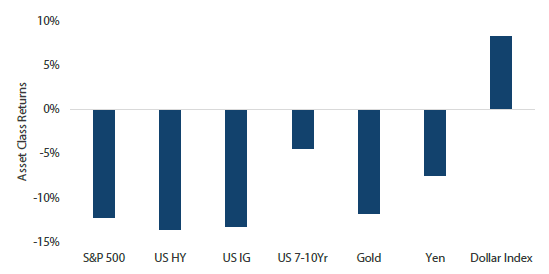
As global central banks unleashed unprecedented liquidity to ease the economic downturn with ever-expanding QE, one might have expected that competitive currency debasement would be supportive of gold. Instead, the price of gold fell to USD 1,471 per troy ounce on 19 March, following the dislocation in USTs and other markets as otherwise safe assets suddenly became “unsafe” because of dried up liquidity.
Chart 5: Asset class returns between 9 March and 19 March 2020
Source: Bloomberg, Nikko AM, April 2020
These price declines echo the GFC experience, when gold fell 22% during 9-22 October 2008. The Troubled Asset Relief Program (TARP) was signed into law on 3 October 2008, and the Fed started QE1 in November of that year. Ultimately, gold entered a massive rally, surging 167% to an all-time high of USD 1,900 dollars per ounce in August 2011.
The current policies are bigger and more aggressive relative to those implemented during the GFC, on both the monetary and fiscal fronts. For instance, the Fed effectively backstopped everything, lending directly to corporations and buying corporate bonds (and more recently high yield bonds) in both primary and secondary markets. The central bank has also expanded eligible asset-backed securities to include student loans, auto loans, and credit card loans. Elsewhere, governments in developed countries have pushed out stimulus packages equivalent to over 10% of their GDP, while guaranteeing all loans. Should the situation normalise, which we expect will happen eventually, these measures should prove inflationary. We believe gold remains the most effective hedge to inflation risk as well as policy mistakes.
REITs and infrastructure
We upgraded REITs and infrastructure marginally compared to last month. REITs valuations have become attractive after the sell-off starting in late February. While we continue to monitor the Covid-19 situation globally, high REIT dividend yields offer attractive opportunities as well as a margin of safety for long-term investors.
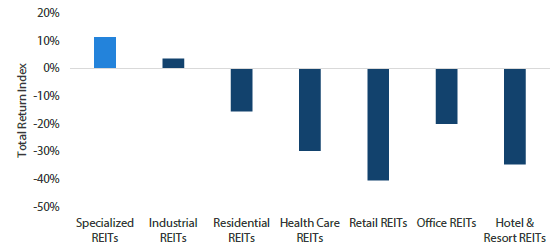
As US REITs markets plummeted in March, service and consumer related REITs (retail REITs, hotel REITs) slumped the most, suffering losses of 40% to 50%. In comparison, specialized REITs and industrial REITs stood out as defensive sectors. As most states in the US issued strict “stay at home” orders, malls and outlets were unsurprisingly the hardest-hit sectors. March rents were mostly paid, but many retailers are struggling to pay in April. Between drawing on credit lines and laying off employees, the companies can largely survive for now but we will see more companies going out of business the longer the lockdown lasts.
Some retailers have publicly announced they will not pay their April rent, causing immediate cuts to retail REITs’ earnings and price targets. Similarly, as tourism and business travel freeze, hotel REITs’ earnings projections were also slashed. The successful flattening of the Covid-19 infection curve and the resumption of economic activities remain the biggest swing factors for retail and hotel REITs’ future revenue and performance.
US specialized REITs mainly consist of data centres and telecom towers, which are less affected by “stay at home” orders. In some cases, revenues have improved given the increased demand for bandwidth as employees work from home and seek online entertainment as an alternative to going out. Data centre fundamentals are defensive with recurring revenues, long lease duration and now an acceleration in economic digitalisation.
Chart 6: US sub-category REITs year-to-date return
Source: Bloomberg, April 2020
Process
