The global shutdown to contain the coronavirus makes a global recession fairly certain, but we need to be reminded that the recession was self-inflicted—an economically-induced coma in the interest of public safety with a heavy dose of fiscal and monetary stimulus offering life support.
If you believe the procedure will work flawlessly, the economy will bounce back strongly on the release of pent up demand once it is allowed to come back to life. More likely, parts of the economic machine will show damage, slowing the return of activity. In emerging markets (EM), the weakest will likely continue to struggle, but even the strong will need to prepare for even faster de-globalisation.
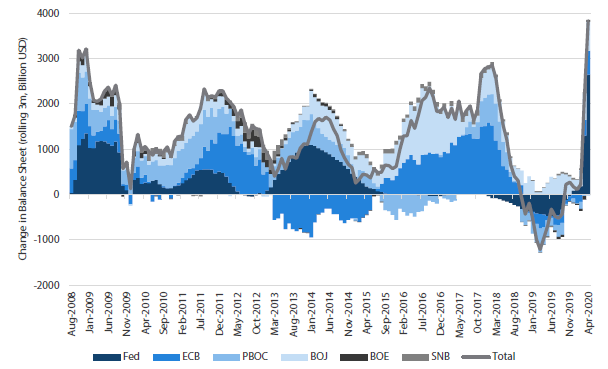
In the short term, EM could benefit from a very large fiscal and monetary response from the developed world, offering ample dollar liquidity to help buffer major capital outflows with support for external demand as activity eventually picks up.
Chart 1: Central bank balance sheet expansion accelerates
Source: Bloomberg, April 2020
However, each emerging market has its own challenges, including its containment efforts, while having more limited fiscal and monetary options to help offset the pain from a collapse in demand—both domestically and for its exports as well as tourism.
We expect global demand to pick up in the third quarter and accelerate in the fourth, but some markets will take much longer to recover and could even slip into crisis—which is why we remain highly selective in how we choose our exposures across the EM complex.
Asia: First in, first out
Fast containment in China was clearly beneficial for the region, but with demand for exports now compromised—particularly from the all-important US consumer—the outlook is less clear. Moreover, the event will likely trigger faster de-globalisation as nations have become acutely aware of the weakness of global supply chains in times of crisis.
In the midst of a near-certain global recession, some expected China to apply more stimulus. To some extent it has, given the jump in credit shown in March, but the size of the stimulus is likely to have a modest effect on global demand. For China, the internal focus of the stimulus offers a boost to the private sector, but for the rest of EM, demand (such as for commodities) is likely to remain subdued.
The outlook for the rest of Asia is divided between the north and south. Like China, South Korea and Taiwan have managed to contain the virus, while also benefiting from the restart of the China supply chain where stimulus is being directed to the private sector, including a special focus on technology including 5G and industrial Internet of Things (IoT). ASEAN and India are still working toward containment while local stimulus is relatively small compared to the deep impact on local demand, stalled tourism and weak demand for its exports.
Asset Class Scores
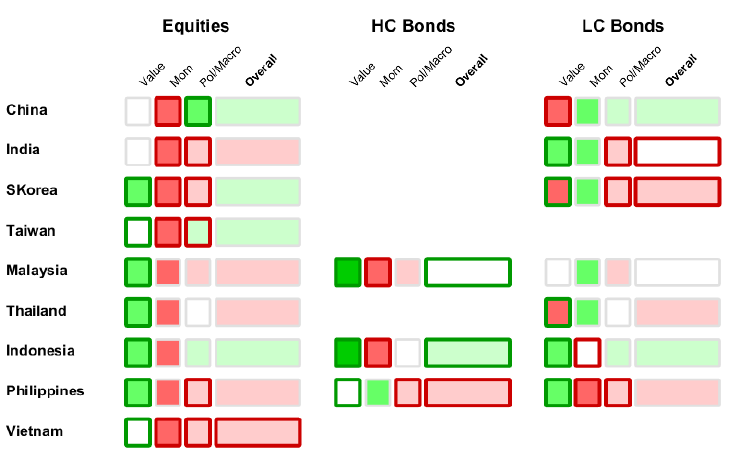
Score Summary: For each country and asset class, scores are represented by colours – white is neutral, green is positive and red is negative. The overall score is shown to the right with the underlying scores – value, momentum and political/macro – shown to the left. The border shows grey for no score change, while green shows positive and red negative.
The asset classes mentioned herein are a reflection of the portfolio manager’s current view of the investment strategies taken on behalf of the portfolio managed. These comments should not be constituted as an investment research or recommendation advice. Any prediction, projection or forecast on sectors, the economy and/or the market trends is not necessarily indicative of their future state or likely performances.
India and Indonesia remain vulnerable
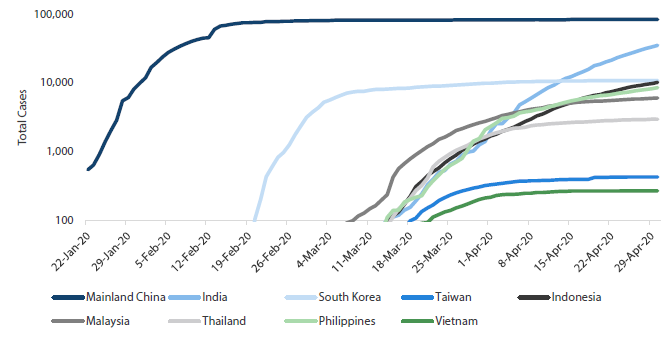
Within Asia, India and Indonesia may be the hardest hit by the coronavirus, so far lagging regional neighbours in terms of flattening the curve (Chart 2) as both countries suffer from weak healthcare systems, large populations of vulnerable, low income workers and less capacity to maintain a shutdown at least partly due to weaker fiscal resources.
Chart 2: Total COVID-19 cases in Asia
Source: Johns Hopkins University, April 2020
Freezing activity has caused deep economic pain for both countries. In India, nearly two-thirds of the labour force is either self-employed or consists of casual labour. This segment of the population has been hit badly by mobility restrictions. In Indonesia, about half the labour force, many from the agricultural sector, had stopped working in April.
In India, with only limited fiscal capacity to soothe the economic pain, the government recently moved to ease restrictions to let some activity resume, despite the fact that the new number of cases has continued to rise. Practically, they may have no other choice, in our view. On the other hand, Indonesia is still adding to restrictions, moving to ban travel out of Jakarta – the epicentre of the outbreak—which is sensible given the country’s fatality rate was still disturbingly high at 7.8% at the time of writing.
On the plus side, both countries have very young populations, which means the ultimate fatality rate might be relatively lower, except to the extent that healthcare systems are overwhelmed and a lack of treatment access results in unnecessary deaths. The coming weeks will be important for determining which factors weigh more importantly for these two vulnerable countries.
EMEA: The perfect storm
The crisis has deeply exposed weaknesses within EMEA, including the fiscal and external imbalances of South Africa and Turkey and Russia’s dependence on oil. All three countries have struggled with containment while new virus cases in Russia continue to accelerate.
South Africa and Turkey were vulnerable to begin with, so it is not a surprise to see the current crisis expose their unsustainable policies. Moody’s (finally) downgraded South Africa’s sovereign rating to sub-investment grade, expecting the budget deficit to widen to 8.4% of GDP in 2020 as the country slips into a deep recession. While debt levels in Turkey are more moderate, the fiscal deficit is forecasted to exceed 6%, accelerating the slippage which has become more structural in recent years.
Russia is by far the strongest of the three in terms of its fiscal and external position, but the collapse in oil demand combined with the temporary break-down of OPEC resulted in an unprecedented shock. Russia has plenty of dry powder to weather the storm, but the rapid change in terms of trade still presents major short-term headwinds.
Asset Class Scores
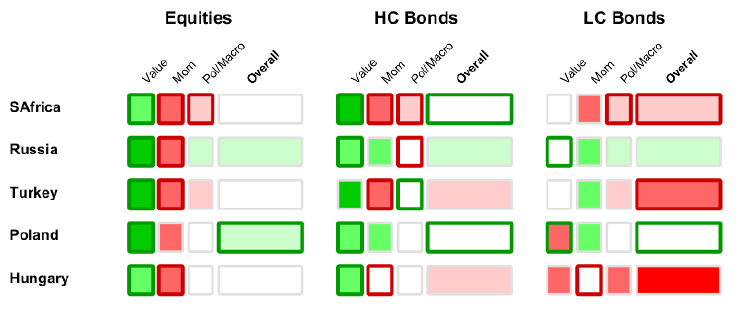
Score Summary: For each country and asset class, scores are represented by colours – white is neutral, green is positive and red is negative. The overall score is shown to the right with the underlying scores – value, momentum and political/macro – shown to the left. The border shows grey for no score change, while green shows positive and red negative.
The asset classes mentioned herein are a reflection of the portfolio manager’s current view of the investment strategies taken on behalf of the portfolio managed. These comments should not be constituted as an investment research or recommendation advice. Any prediction, projection or forecast on sectors, the economy and/or the market trends is not necessarily indicative of their future state or likely performances.
Turkey throwing caution to the wind
In the face of a crisis, emerging market policymakers are often faced with conflicting objectives: (a) easing policy to support domestic demand versus (b) not easing policy too much or even tightening policy to support external demand for its currency and debt. This time around, Turkey turned on both the monetary and fiscal spigots, placing the domestic demand objective well ahead of supporting external demand for its assets.
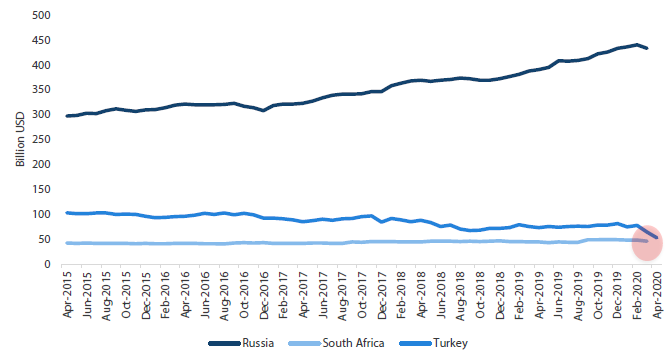
Fiscal slippage is a concern, but easy monetary policy might be the bigger current concern for Turkey. In April, the central bank cut rates by another 100 basis points (bps) to 8.75%, more than 2% below the 10.94% inflation rate that is likely to remain elevated for some time. Meanwhile, the current account has slipped back into a deficit, while currency reserves continue to be reduced to very dangerous levels as shown in Chart 3.
Chart 3: EMEA FX reserves
Source: Bloomberg, April 2020
We have long described Turkey as among the most vulnerable within EM, this proved to be the case back in the summer of 2018 when the country faced a brutal economic adjustment. However, short of any meaningful reform efforts, the adjustment proved to be temporary. Once again, Turkey has twin deficits requiring external funding, and therefore it could easily be forced back into an economic adjustment if it can’t meet its funding needs.
Latin America even more challenged
The coronavirus hit Latin America in mid-March, starting with Brazil, and so far containment efforts have been slow to produce any results. Presidents Jair Bolsonaro of Brazil and Andrés Manuel López Obrador of Mexico were slow to push containment measures, so coronavirus infections gathered pace and lengthened the timeline for flattening the curve.
Argentina, Mexico, and Colombia are likely to be most affected, economically. Politically, it is Argentina, Brazil and Mexico that are the most vulnerable. The Andean countries are better positioned in the short term given more stable politics in Peru and strong fiscal support in Chile, though they still face substantial challenges in the long term.
Mexican assets were downgraded mainly on account of all three ratings agencies downgrading the state-owned petroleum company Pemex to junk for its already weak financial position, made worse by the crash in oil. Because the company’s financial problems become the country’s fiscal problem, the sovereign rating is at risk as well.
Brazil may be the biggest disappointment this quarter as the country enters yet another political crisis, this time involving President Bolsonaro apparently attempting to cover up a scandal by firing the head of the Federal Police, causing the country’s justice minister to exit the administration. Hopes for further reforms have been greatly diminished given the likely continued fallout that could distract from the reform agenda.
Asset Class Scores
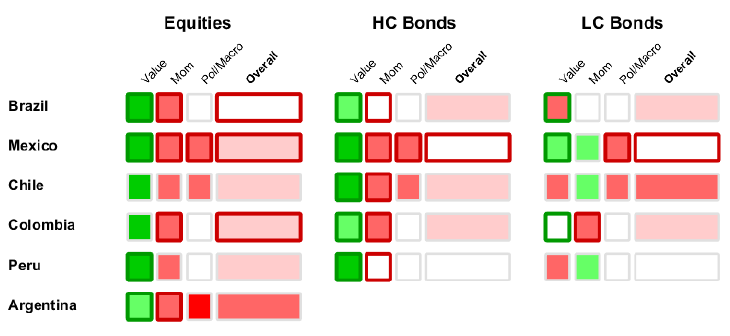
Score Summary: For each country and asset class, scores are represented by colours – white is neutral, green is positive and red is negative. The overall score is shown to the right with the underlying scores – value, momentum and political/macro – shown to the left. The border shows grey for no score change, while green shows positive and red negative.
The asset classes mentioned herein are a reflection of the portfolio manager’s current view of the investment strategies taken on behalf of the portfolio managed. These comments should not be constituted as an investment research or recommendation advice. Any prediction, projection or forecast on sectors, the economy and/or the market trends is not necessarily indicative of their future state or likely performances.
Brazil back in crisis
Since his election in 2018, President Bolsonaro’s efforts to push important reforms have been impressive. Growth remained weak, but since the fiscal position was kept adequately tight, markets were willing to give the benefit of the doubt that reforms would eventually deliver a sustainable fiscal trajectory.
Since the onset of the pandemic, Bolsonaro has remained vocally in denial of the coronavirus. This has cost him politically, but he partially offset such a disadvantage by managing to push through a sizable fiscal package. However, while the resulting fiscal slippage (estimated at 7% of GDP) might have been overlooked given ongoing efforts to push reforms, the emergence of a new political crisis that threatens the reform agenda simply cannot be ignored.
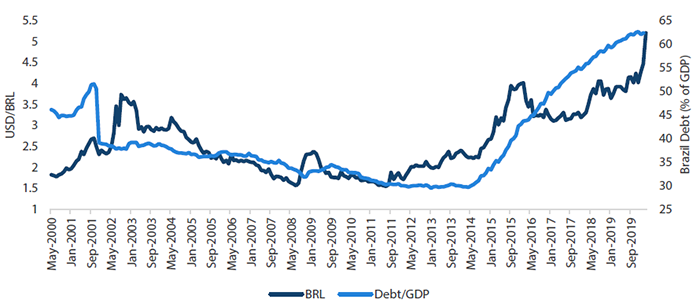
The speed of the selloff in the Brazilian real (BRL) has been swift and extreme since January as government debt levels look increasingly unsustainable if reform efforts stall. For the real, the 4-per-dollar ceiling had held for more than twenty years, but the currency has decisively broken weaker to the current 5.5 level.
Chart 4: Brazilian real versus debt-to-GDP
Source: Bloomberg, April 2020
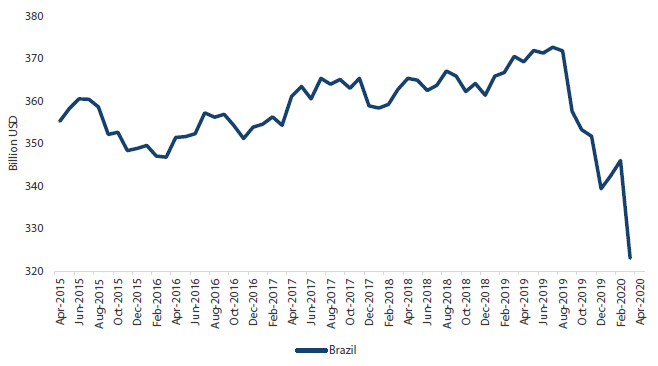
Arguably, the central bank cut rates too deeply, from 6.5% in July 2019 to 3.75% in March 2020, just 45 bps above the CPI of 3.3%. The central bank began to sell down reserves to support the currency back in August 2019, which more or less worked through the year-end, but such efforts have clearly not worked in 2020.
Chart 5: Brazil FX reserves
Source: Bloomberg, April 2020
The outlook is firmly negative for the time being, pending better visibility on how the political crisis unfolds. The central bank is a strong institution and could walk back some of its rate cuts to date, but so far there is no indication of such a policy shift taking place.


