

Snapshot
The Covid-19 pandemic has undoubtedly had a devastating impact on public health, economic activity and financial markets. Given the forward-looking nature of markets, asset prices began to weaken first as news of an unknown deadly virus began to filter out of China to the rest of the world. Following this warning signal, the potential scale of the public health crisis began to reveal itself as the virus outbreak turned from a local outbreak to a global pandemic. As government authorities around the world implemented containment and mitigation strategies to combat the spread of the virus, economic activity began to slow sharply. As we know, this transition from financial market warning to public health crisis to global economic recession took place at warp speed over a 3-month period.
Although we expect any recovery from Covid-19 to take longer, we think it will essentially follow the same sequence in the months ahead. Financial markets have already bounced considerably with risk assets recovering substantially from lows set in March. The S&P 500, for example, has recovered nearly two thirds of the losses it suffered from its high in February to its low in March. The alarming deterioration in growth asset prices brought out a powerful mix of monetary and fiscal policy actions by central banks and governments and so far, these actions have been largely successful in providing support to financial markets.
In addition to these financial actions, governments around the world (in particular western countries) began to address the spread of the virus seriously with a series of containment and mitigation measures. As a result, we have remained focused on the relative effectiveness of the shutdown to slow the virus spread. On this metric, original epidemiological forecasts may have been too gloomy as enforced shutdowns and social distancing measures appear to have been effective in curtailing the spread of the virus. The good news at least appears to be that health care systems in most countries have not been overwhelmed during the first wave; however, the bad news is that the global economy has been brought to a near standstill to achieve it.
The downturn in global economic data has been considerable, and while we knew it was coming given the nearly universal shutdown, it does give us pause as economic data releases begin to reveal the damage. Even still, we remind ourselves of the mirror image in the form of the massive fiscal and monetary response and ponder whether it will be enough to counter it. Many are optimistic that it will and we cautiously agree, provided we avoid a second outbreak requiring a repeat of the global shutdown.
The key question is how quickly and to what extent the economy can navigate back to reasonably normal demand patterns. Many companies will go out of business and some industries will be changed forever, but there is also a sizable portion of the economy that is simply on hold where the recently unemployed can be reabsorbed as normal conditions return. However, there are also vast unknowns include changing behaviours and patterns of consumption or bankruptcies that can metastasize to infect broader portions of the economy.
Asset Class Hierarchyy (Team view1)
")
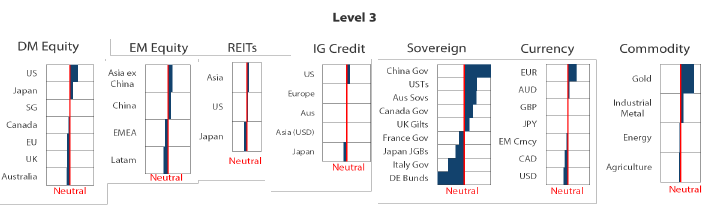
1The asset classes or sectors mentioned herein are a reflection of the portfolio manager’s current view of the investment strategies taken on behalf of the portfolio managed. The research framework is divided into 3 levels of analysis. The scores presented reflect the team’s view of each asset relative to others in its asset class. Scores within each asset class will average to neutral, with the exception of Commodity. These comments should not be constituted as an investment research or recommendation advice. Any prediction, projection or forecast on sectors, the economy and/or the market trends is not necessarily indicative of their future state or likely performances.
Research Views
We adjust our asset class views and hierarchies as discussed below.
Global equities
As countries assess the relative success of containment efforts in order to ease restrictions, Japan stands out for its success utilizing a fundamentally unique approach. Rather than ordering broad lockdowns, Japan called a state of emergency with only a “semi-lockdown” and a more targeted approach for stopping the virus. Early on, Japan determined the tracing would be too complex and testing inadequate, so it instituted a strategy to identify and contain so-called “super-spreaders”—those that infect large numbers of people. How such people are identified is unclear, but the strategy seems effective with new cases down 93% from the 11 April peak, and Japan has started easing restrictions in parts of the country.
Given Japan’s easing of restrictions, there is arguable cause for equities to rally, but alas, a still strong yen and ongoing trade shock induces a nearly Pavlovian response to sell Japan equities. Is the selling pressure justified? To some extent, yes, as Japan does depend on exports and a strong yen weighs on earnings and its competitive advantage, but the selling pressures may be overdone given its compelling valuations.
In the case of Japan, describing equities as “cheap” is incomplete, as parts of the equity market have been deflating since the 1990s—namely, financials following the credit bubble burst. However, as shown in Chart 1, the price to book (PB) of the broad market versus ex-financials has diverged since around 2013 when Abenomics reforms were first introduced. While financials trade below book, partly for negative rates, the rest of the market trades at 1.3 PB, about 23% below the 1.7 near-term peak at the end of 2017.
Chart 1: Price to Book, MSCI Japan versus MSCI Japan ex-financials

Source: Bloomberg, April 2020
Japan ex-financials valuations diverged for good reason—better returns. Reforms brought better corporate governance helping to lift profitability with higher dividend payouts. Many Japan companies are industry leaders and are key participants in the global supply chain. As supply chains reconfigure, Japan is likely to be a relative winner given its balanced relationship with both the US and China, though it will not be without challenges.
Do these trade challenges justify Japan equities trading at a 60% discount to US equities, which have their own headwinds? Probably not, and while valuation divergences can persist for extended periods, we still like Japan (nonfinancial) equities for their high quality and attractive valuations.
Global bonds
The policies pursued by the world’s major central banks have always been of primary importance to understanding the behaviour of interest rates. Perhaps now more than ever, with official target rates converging to their respective effective lower bounds and ongoing large-scale asset purchases, central bankers are in charge in sovereign bond markets. Bond volatility has returned to pre-Covid-19 levels and yields have stayed low as a result.
As we look ahead, we are not expecting much to change in coming months as central banks have also been providing the market with guidance about their future actions (or lack thereof). The US Federal Reserve (Fed) has indicated that policy is likely to remain at its effective lower bound until the economy is past the pandemic and on-track to meet the Fed’s goals of maximum employment and price stability. When pressed by journalists after the Federal Open Market Committee meeting in April, Fed Chairman Jerome Powell suggested that market pricing of no change in rates through 2020 and into 2021 seemed reasonable. The European Central Bank has used similar language for its forward guidance and other major central banks have also given assurances that policy will remain accommodative for some time.
Chart 2: Global sovereign bond yields

Source: Bloomberg, May 2020
As a result, our relative views on sovereign bonds can be simplified to focus on current 10-year bond yields and the steepness of yield curves as shown in Chart 2. We expect Australia, the US and Canada to outperform given the combination of higher 10-year bond yields and steeper yield curves. However, we take a more neutral stance on the UK and France and expect Japan and Germany to lag the rest of their global peers.
Global credit
Central bank intervention in fixed income markets has been a substantial tool for governments in their response to the Covid-19 pandemic. While asset purchase programmes have uniformly targeted sovereign bonds, non-government or corporate bonds have also been included as eligible assets by many central banks. Table 1 looks at various credit securities that have featured in central bank programmes.
Table 1: Eligible assets for central bank asset purchase programmes

Source: Central bank announcements, May 2020
The Fed has been leading the charge among global central banks in responding to the financial market upheaval wrought by Covid-19. Fed programmes are eligible to purchase investment grade bonds in both the primary and secondary markets, even extending to high yield bonds under certain circumstances. So far, other central banks have not followed the Fed into high yield, restricting their programmes to investment grade-rated bonds. The Fed has also recognised the rise of fixed income ETFs by including them as eligible assets while others have not. However, other central banks are similarly supporting corporate borrowers by purchasing high-grade commercial paper and corporate bonds, with the exception of the Reserve Bank of Australia. Australia’s central bank has been the least interventionist, seemingly confident that its credit markets can function well enough without its participation. Nevertheless, support for credit markets has been substantial and gives us confidence to take advantage of cheaper valuations where support is greatest in the US.
FX
The USD has been range-bound as global funding pressures and risk sentiment started to improve notably following the swift and massive fiscal and monetary programmes rolled out by policymakers. However, the USD is still trading at relatively elevated levels. As the magnitude of the economic drag from virus containment strategies is eventually revealed through published data points, governments worldwide are actively mitigating the impact by introducing more supportive measures. While domestic factors have caused weakness in many of the constituent currencies in the DXY index, the increase in global policy uncertainty has also supported the DXY index at current levels.
Other than the superiority of US economic growth relative to the rest of world, which was discussed last month, the Fed’s aggressive measures are reflected in the central bank balance sheet changes relative to the rest of world (see chart 3). This could imply that the current levels of USD might not be sustainable on a medium term time horizon. In recent years, the currency direction has been more sensitive to the direction of relative balance sheet change. As the US attempts to reopen its economy gradually while trying to manage the pandemic, supportive measures are likely to remain in place for a prolonged period. As the world is grappling with how a post-pandemic world might look, some risks to USD strength will be whether US global economic leadership eventually unravels and if its policy measures such as quantitative easing and massive fiscal spending undercut support for the currency.
Chart 3: US central bank balance sheet 3-month change over the rest of the world

Source: Bloomberg, May 2020
Commodities
While sentiment remains weak, we feel the world is on the mend and recovering, supported by unprecedented stimulus, while on the other hand people are getting used to the new norms of social distancing. Industrial metals have shown relative stability within the commodity complex, as shown in Chart 4.
Chart 4: Commodity performance year-to-date

Source: Bloomberg, Nikko AM, May 2020
As the global economic engine restarts, commodities in general should benefit from improving demand. However, unlike crude oil, which is stuck in a supply overhang, supply and demand for industrial metals are much more balanced. Copper is an example. At the beginning of 2020, some inventory was building up in Shanghai exchange warehouses due to the Chinese New Year. The outbreak of Covid-19 in China delayed the reopening of factories; however, when they finally opened in March, inventory depleted quickly.
Chart 5: Copper inventory

Source: Bloomberg, Nikko AM, May 2020
We are also more confident about demand recovery for industrial metals than energy, whose top consumer is the transportation sector. While the great social lockdown will ease eventually, we believe this will only happen in phases. International travel is probably the last thing governments want, as long as the virus has not been fully contained globally, and a vaccine remains unavailable.
REITs and infrastructure
We downgrade REITs’ overall scores marginally relative to last month. The Japanese government declared a state of emergency in early April, and Singapore extended its circuit breaker to early June. These strict policies will have a negative impact on REITs’ earnings and cash flows. Although governments are expected to loosen restrictions gradually, consumer shopping and tourism activities will take a much longer time to recover. Therefore, hotel REITs and retail REITs cash flows will be under pressure. We remain cautious on REITs’ earnings and near-term performance.
The infrastructure asset class remained relatively resilient compared to equities until early March. As the Covid-19 health crisis turned into a global financial and liquidity crisis, the listed infrastructure stocks plummeted together with equities. Thanks to massive monetary and fiscal stimulus, the asset class has been recovering since late March together with equities. Looking ahead, we maintain a positive view on infrastructure. Firstly, valuations are still attractive. The PB ratio is about 1 for all three UK-listed infrastructure funds, and this cheap valuation was last seen during the 2008 global financial crisis. The infrastructure asset class offers a very attractive yield of 4.5% on average, much higher compared to sovereign or equity yields. Secondly, infrastructure assets provide essential services to the public, and cash flows from most assets are less affected by “stay at home” orders. For example, these orders have little impact on water and energy distribution and utilities, which suggest stable earnings and cash flows. Nevertheless, certain high-beta infrastructure assets (such as airports and seaports) are facing unprecedented headwinds, because of falling travelling activities and global trade volumes.
Chart 6: Infrastructure assets versus equity year-to-date performance

Source: Bloomberg, Nikko AM, April 2020
**Infrastructure Asset Basket is a customized portfolio consisting of four listed infrastructure funds.
Process

