Introduction
The shock US unemployment figures released on 5 June —2.5 million jobs were actually added in May although expectations were for a loss of 7.5 million—got us thinking. Just how fast could a “V” shaped recovery be? We therefore did some digging in the weeds of the employment figures to try and get a feel for what is driving the numbers and provide a back-of-an-envelope calculation of just how quickly employment could recover.
Not all unemployment is created equal
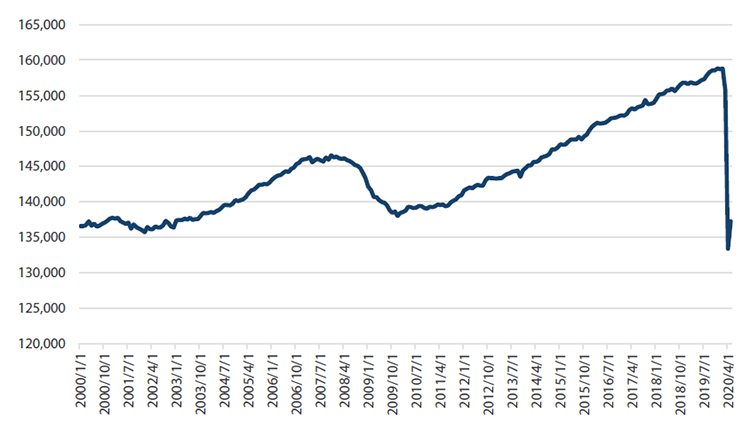
The best place to start this note is to look at the economic damage created so far. Through the past three months, outright employment figures have seen an unprecedented amount of jobs lost, which, to date, has been about 20 million, about two times the damage caused by the Global Financial Crisis (GFC).
Chart 1 US total employment
Source: Bloomberg
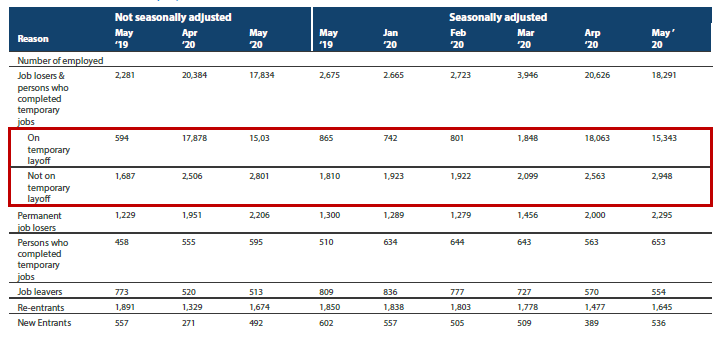
However, the interesting point from 5 June is that not all unemployment is created equal. Here is one (of the many) tables produced by the US Bureau of Labor Statistics, which shows how people are categorising their unemployment.
Table 1 Reasons for unemployment, US
Source: U.S. Bureau of Labor Statistics
Of the ~20 million people who became unemployed due to COVID-19, around 15.5 million currently believe it’s temporary. This is denoted in the top row of the red box, and is completely rational from the employee’s perspective if we believe that, as the economy re-opens, they will start working again. This is not an unreasonable assumption given that three million of these temporarily laid-off workers just returned to work.
From these numbers, we can split those who have become unemployed into three categories.
Table 2 Unemployment categories

The difference between category 2 and 3 is that those in the former lost their jobs but will be seeking new employment, while those in the latter lost their jobs and will not be looking for new employment.
In order to answer the question of how fast unemployment could rebound, we need to make some assumptions about how long it could take for these people to return to work. For simplicity, as a starting point, I assume that those in categories 2 and 3 (i.e. not temporarily laid off) will still be unemployed in 6–12 months’ time, as reemployment will likely come from those in category 1 first.
This means of the 20 million who became unemployed during March and April, two million will be the baseline increase that are still unemployed in the next 6 to 12 months. This raises the more important question: what about those in category 1? How many do we expect will go back to work?
To ball park this, let’s first look at what sectors the employment changes have come from.
The story behind the numbers
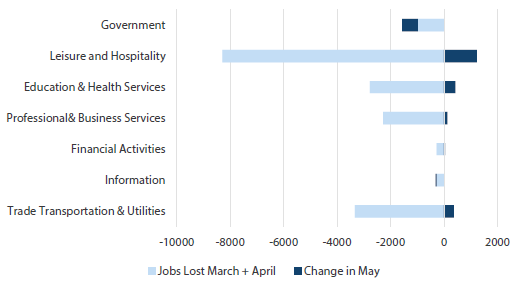
Chart 2 Job changes in the US – past 3 months
Source: Bloomberg
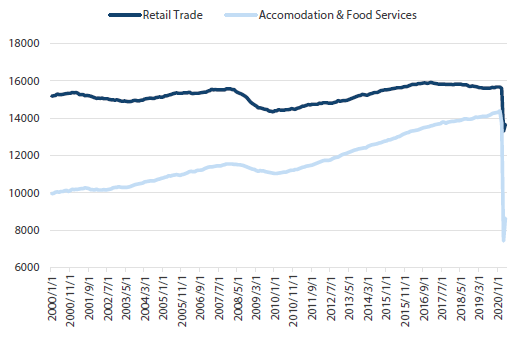
Most of the job losses were in leisure and hospitality, and trade, transportation & utilities, which in March and April shed about 12 million jobs combined. However, if you look at the re-hiring that came through May, most of the employment was in the hardest-hit sectors, with the subcategories (not shown here) of food services & drinking places, and retail trade showing some strong employment.
Chart 3 US industry employment
Source: Bloomberg
Here is a more detailed sector breakdown of US employment: https://www.bls.gov/news.release/empsit.t17.htm
Because of the unprecedented drop in these sectors shown in Chart 3, let’s now assume that of the people in category 1 (i.e. those temporarily unemployed), 75% of them return to their jobs when the economy reopens and 25% find it challenging to return to their existing employment. That would give us the following estimates.
Table 3 Return to work estimates

This would result in approximately four million people (of those 15.5 million currently temporarily unemployed) remaining unemployed in the next 6 to 12 months. When we look across the different categories, we land on a total unemployment increase of eight million people—consisting of 3.9 million from the above (category 1), 2.9 million who have been laid off (category 2) and 1 million who have exited the labour force (category 3).
This gives us an unemployment rate of around 7–8%. Interestingly, 8.6 million jobs were lost during the GFC, from peak to trough.
If we take a step back and survey the numbers, a few questions arise:
- Could the economy add back 12 million jobs in 6–12 months?
I think in the current circumstances, the answer seems to be yes (recognising that there are no guarantees). If half of those employed in accommodation & food services and retail trade (see Chart 3) returned to employment when the economy opens, that would equate to six million jobs. Given the scale of the decline and government policies in place, this doesn’t seem unreasonable. Having said that, my ‘fixed income gut’ tells me that it feels a little too optimistic. - Filling 12 million jobs in 6–12 months would require 1–2 million jobs per month over the short term. Has that ever happened before?
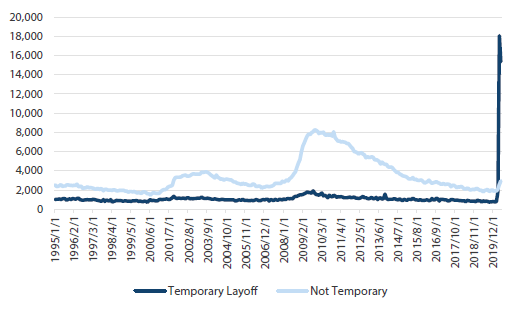
No. History shows the US economy can put on ~500,000 jobs following a recession, but it very rarely exceeds a million. That being said, we have never experienced these conditions before, particularly for those who believe it is all temporary—see Chart 4. - Is 75% a good estimate of the temporary change?
This is the most challenging question to answer. Getting more granular with the estimate by sector would offer some insight, but it’s only an estimate at best.
Chart 4 US reason for unemployment
Source: Bloomberg
Once these “temporary” workers are re-employed, I would expect the pace of re-employment will slow considerably, leaving a percentage of workers who thought they were only temporarily unemployed now out of work for a longer period of time.
To put this into context for rates, the US Federal Reserve (Fed) didn’t hike rates until 2015 (seven years after rates were effectively lowered to 0%), when the unemployment rate fell to about 5%. If the above estimate is correct and unemployment in 6–12 months’ time is at 7–8%, then we can add another 3–5 years to the time it could take for the unemployment rate to fall from 8% to 5%.
This would leave rates at zero for the next four (at the lower end of the estimate) to seven years (at the higher end), before the Fed was in a position to contemplate higher rates—well beyond the Fed’s recent commentary that rates will be low until at least until 2022.
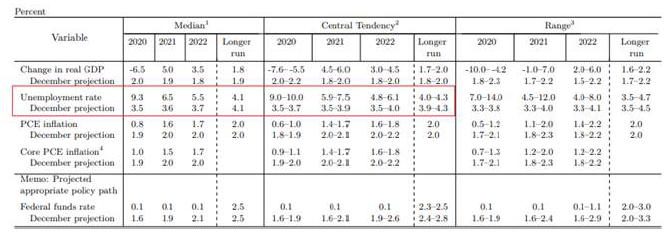
On Monday 8 June, the Fed released these central estimates for unemployment (see Table 4). The short-term impact looks similar to what I described above—unemployment will sit within the 7%–9 % range in 12 months’ time. However, the Fed assumes the rate will drop back to 5% in 2022, which seems like a relatively optimistic forecast in our view.
Table 4 Estimated unemployment rates, US
Source: US Federal Reserve
Finally, we also need to be aware of the risk that could be lurking for the employment figures, as there is still a decent chance that those who are “temporarily unemployed” morph into something else. As an example, at the recent LA protests, more than 50,000 people crammed into the Hollywood Boulevard during a pandemic. Does this set the scene for the second wave of infections, which have already been rising in a number of US states?
Conclusion
Looking at the number of people who believe they are temporarily employed and the speed with which they could return to the economy suggests that the first phase of the recovery could see the unemployment rate drop to 7–8% before it begins to slow down. From a historical perspective, this is still relatively high unemployment, but drastically better than the 15% seen in April.
Once the economy reopens, and these temporarily unemployed people find work, the gains will be harder to come by. Hence, a recovery in unemployment will look impressive compared to where we are now, but it will still only be at levels associated with a recession. As such, while the Fed says that rates will remain low until at least 2022, I this could actually be far longer, in our view.


