Summary
Over the past three years Australian house prices have mostly moved sideways, rising or falling by around 10% per year. When prices started falling in 2018, we saw little reason to be concerned as housing affordability remained strong, unemployment was low and interest rates had room to fall. This setup the conditions for the Reserve Bank of Australia (RBA) to act, breathing life into the housing market. And then COVID-19 hit, bringing with it dramatic changes to our landscape. Unemployment is now at a 20-year high, immigration is non-existent and interest rates have hit the lower bound. So, just how worried should we be?
History repeats
The current housing figures have been remarkably resilient given the circumstances, as house prices have fallen by about 1% over the past three months. This is occurring through some of the worst economic conditions Australia has seen in the past 70 years. Most forecasts in the market suggest there will be continued declines to come, but of a magnitude that is not dissimilar to 2019. With this backdrop in mind, we look at both the short-term indicators and long-term drivers to help determine if this relatively benign outlook should hold.
Chart 1 Australian house price index
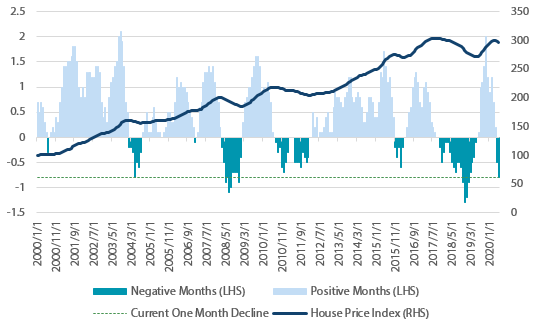
Source: Bloomberg, CoreLogic, Nikko AM
The usual suspects – Short-term forward indicators
When determining a short-term outlook for house prices, three key indicators prove particularly useful: auction clearance rates, mortgage finance and building approvals. At the moment, these indicators are not pointing to serious concerns around housing, with the more likely short-term outcome being a decline in the 5 – 10 per cent range.
1. Auction clearance rates
Auction clearance rates give a timely indicator of sentiment. When the Australian economy was in total lockdown during April 2020, auction clearance rates plummeted. They have since recovered into the mid-60 per cent range, however weak outcomes persist in Victoria. From an historical perspective, this would imply house price outcomes are slightly better than the declines seen in 2010 or 2018; making prices flat when compared to this time last year. To end up flat year-on-year over the next few months, we would need to see a 5 per cent fall in prices to offset the late 2019 strength.
Chart 2 Auction clearance rates and house prices
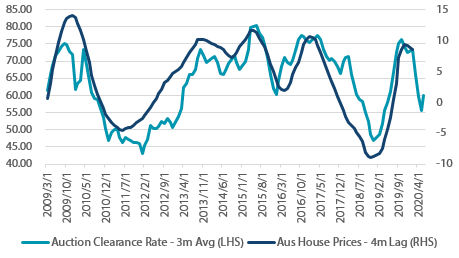
Source: Bloomberg, Nikko AM
2. Mortgage finance
The level of mortgage finance going through the economy reflects the volume of borrowing. Unfortunately, the most recent data point is from May, which is highly impacted by the lockdown, but nevertheless showed some of the largest declines in finance of the past 20 years. This paints a bleaker picture than the auction clearance rates, with prices pointing slightly negative year-on-year. Mortgage finance has fallen from its lofty levels during late 2019 and we expect this should weigh on prices—potentially in the 5 to 10 per cent range over the next few months.
Chart 3 Mortgage finance and house prices
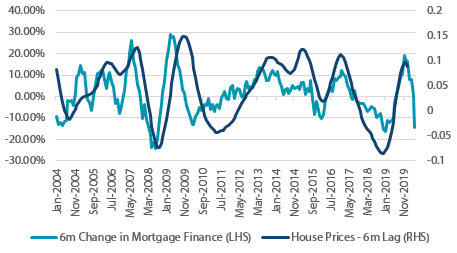
Source: Bloomberg, Nikko AM
3. Building permits for new homes
This indicator typically moves in the same manner as house prices. The most recent figures for building permits show there’s been a quick decline in the intention to build, which signifies house price weakness in the near term as developers expect sales will be harder to achieve.
Chart 4 Building permits, new houses and house prices
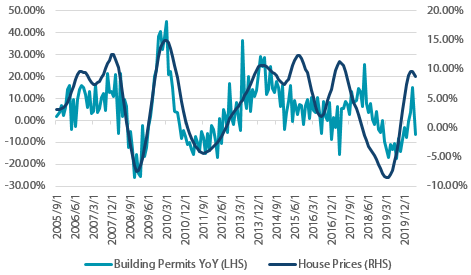
Source: Bloomberg, Nikko AM
In the short term, all three indicators are pointing to the same outcome: house price declines of approximately 5 – 10 per cent, which could be towards the lower or higher end of that range depending on which indicator is preferred. When answering our original question—“How concerned should we be?”—these indicators tell us that we should be at least mildly so.
Yet this outlook only reflects what is already known (and observable), providing only a 3 – 6 month outlook without making much reference to what could be in store in 12 months’ time. Currently, Australia is facing its worst economic performance in 70 years with very little room for rates to fall. So, we must also think about how these indicators could move in the bigger picture environment.
The bigger picture drivers
Typically when discussing Australian housing, the narrative goes along these lines: “Yes our house prices are some of the most expensive in the world, but we have strong migration, good affordability and constricted supply compared to other countries, which justifies the high prices”.
Under ‘normal’ conditions, this argument holds water. But in the current climate it becomes extremely questionable. As such, we look to the bigger picture indicators—unemployment, immigration, fiscal support and interest rates—to glean the potential direction of the housing market.
1. Unemployment
The largest risk to the property market at the moment comes in the form of unemployment, as Australia faces an unprecedented level of job losses. While the official unemployment statistics can show some noise, due to how those who have lost their job are classified, the statistic of the percentage of the working age population that is employed shows how drastic this has been. Around 3.5 per cent of the working-age population lost their jobs since March, which does not include those who are currently on the JobKeeper program (~3 million people). This is a decline of close to 700,000 jobs and is two times larger than that seen in the early 1990s recession and four times larger than the 2008 recession.
Chart 5 Employment to population change
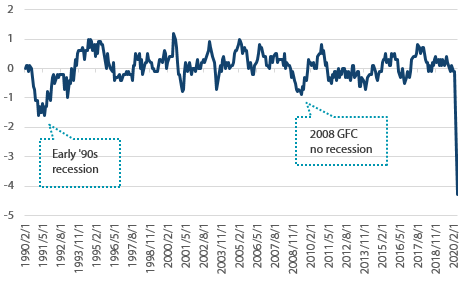
Source: Bloomberg
Looking at the raw figures of total employment in Australia explains why it is difficult to make any comparisons to the GFC from an Australian perspective. While the economic damage was bad globally in 2009, it was muted in comparison in Australia as we avoided the worst of the fallout, registering only a benign slowdown in employment.
Chart 6 Australia – Total people employed
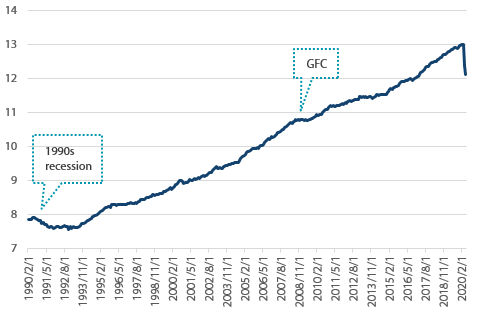
Source: Bloomberg
This huge level of unemployment has brought with it economic hardship that has required relief from the banking system. The Australian Banking Association has said that almost 500,000 borrowers have been granted loan deferrals, with the Australian Financial Review stating that about 1 in 5 of these ”Are in deep financial strife”. The Australian Prudential Regulation Authority (APRA) states that deferrals across home loans account for about 10% of all loans.
The problem that this unemployment situation creates is two-fold. Firstly, since the capital treatment for loan deferrals was originally given for only six months, each application will need to be reviewed by the banks come September. APRA announced in July that they would extend the deferral process for another six months, until March 2021, but that the temporary capital measures given to the banks can only be applied “Where the ADI has undertaken an appropriate credit assessment of the borrower and is satisfied that they have a reasonable prospect of being able to repay the loan…when the repayment deferral period ends”. APRA additionally stated that “in some cases, banks will need to recognise that loans are permanently impaired”.
This means that there will be a risk that some loans become impaired in September, as a more complete picture of the potential for employment outcomes will be known. If a sizeable amount of those 1 in 5 who are in deep financial strife are deemed not able to repay, then there could be tens of thousands of forced sellers hitting the market in the back end of this year. While we do not expect this is the most likely outcome, as the new deferrals shift this risk to March 2021, CoreLogic statistics show that over the past two years about 30,000 to 40,000 properties sell each month in Australia. This means these borrowers alone could account for three months’ worth of volume, coming at a time when volumes have been lower than usual.
Secondly, with 800,000 Australians having lost their job and another 3 million facing some uncertainty with how long the government’s JobKeeper program will run (addressed below), it’s hard to envision who will be stepping up to buy properties that are being sold by those in financial distress. If the unemployment problem persists longer than the market currently expects, which is a distinct possibility now that Victoria has shut down Melbourne and Sydney COVID-19 cases are rising (at the time of writing), there will be continued pressure for prices to move lower. From the Australian perspective, we haven’t faced a situation like this for almost 30 years and the only way this can be spun as a positive is that APRA is buying time for a recovery to take hold, yet even then household leverage will only be rising through this time.
2. Fiscal stimulus
The current iteration of the government’s higher-than-usual unemployment benefits were recently rolled for an additional six months, however will offer lower benefits than previously received. A closer inspection of the figures shows why this will be so important for the housing market.
Currently in Australia, there are two forms of stimulus to provide everyday Australian’s support: JobKeeper and JobSeeker. These programs provide $1,500 and $1,115 a fortnight respectively, which is almost two to three times higher than the existing $500 - $600 Newstart payments, and are set to be reduced to $1,200 and $815 respectively come October.
In Australia, the average mortgage balance is $400,000, which on a 30-year term with 3% interest would cost about $780 per fortnight. The bare minimum living expense for a person in Sydney, as calculated using an example lenders Household Expenditure Measure (HEM), is $546 per fortnight. With these stats we can now compare how the typical household would fare living with an average mortgage using an estimate of the different government benefits:
Table 1
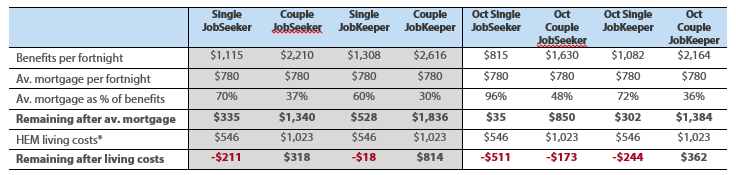
Source: Australian Government, Nikko AM, home loan experts. *HEM living expenses used the lowest income estimate for the Sydney area, assuming no dependants. This is likely an underestimate of the true cost of living for the average person.
The shaded boxes in the table show the current forecasted financial position. While certainly not ideal a single person on the JobKeeper program may just be able to cover their mortgage and bare minimum living expenses, although it would put them in a vulnerable position when considering we used the lowest living cost estimate we could find. For couples on JobSeeker or JobKeeper, the fortnightly income covers a typical mortgage and the minimum living expenses, although this would not look anywhere near as healthy when using the ABS average household expenditure (excluding housing) of around $2,300 per fortnight. This highlights just how important the increased spending from the Australian government has been for enabling households to continue meeting their minimum living expenses.
Compare this to the outcome that will be observed come October, when the payments are reduced—the right hand side of the table. With this level of support the typical household will start experiencing financial stress, especially those on JobSeeker as the $815 payment for a single person would only just cover the typical fortnightly mortgage payment, without accounting for any other living expenses.
Chart 7 Average estimated financial position per fortnight
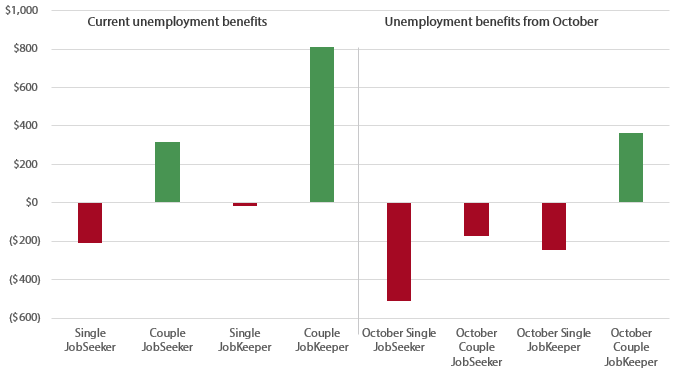
Source: Australian Government, Nikko AM, Home loan experts
These metrics show just how important the policy response has been from the federal government, as it has moved millions of people who would have been on the Newstart Allowance out of a position of severe financial stress and into a position where they can at least meet a bare minimum of living expenses. However, there is now the risk of the economy having to deal with another shock, as households that believed this was going to be a relatively short stint of unemployment must now face the prospect of a longer duration in unemployment coupled with declining unemployment benefits.
As noted above, approximately 700,000 Australians have lost their job (so will be reliant on JobSeeker) and more than three million people are currently on the JobKeeper program. Should these people find themselves in financial stress due to falling income come October, there could be more forced sellers in the property market. If they are only receiving around $400 per week, even a moderate mortgage will find it close to impossible to service their loan without relief or drawing down other assets.
And while not addressed above, this analysis also holds true for the large number of Australians who are renting, paying on average $872 a fortnight. Should these people be unable to afford rent, property investor income will be jeopardised, household formation will go backwards (as people look to live with more people in each household) and the demand for housing falls. Particularly concerning for the younger generations in Australia, given these are the people who are more likely to be renters.
The numbers and potential for financial distress are startling, without even accounting for the fact that unemployment benefits are set to fall even further in January. While it is positive that the government has extended the JobKeeper and JobSeeker programs longer than they original envisioned, the financial bill that the government will incur if these policies continue means that we should now expect them to slowly be wound back; setting up a worrying outlook as stimulus declines.
3. Immigration and population growth
One of the most important drivers for housing demand over the long run will be population growth, as the greater the population of an economy, the more housing that is required. Over the past five years, the Australian population has been increasing by approximately 350,000 people per year, with roughly 220,000 of those coming from overseas. Given the borders are expected to be shut until 2021, immigration will be weak for at least the next six months—moving population growth closer to the natural increase of 140,000 people, a reduction of ~60% vs a normal year.
Since the average Australian household has 2.6 people living in it, this will be a reduction in demand of around 80,000 properties per year while the borders remain closed.
Chart 8 Australian population growth
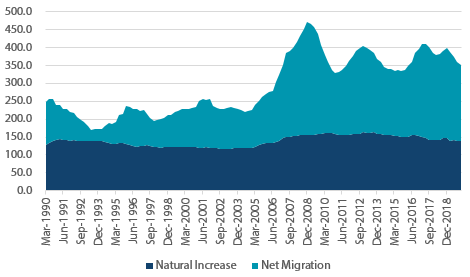
Source: Australian Bureau of Statistics
To better understand the dynamics of the housing demand factors, supply must also be included in the equation. That is how much new demand are we seeing (via population growth) against how much new supply has come via construction.
Over the past five years, rising house prices and lower interest rates have encouraged higher levels of building, with the number of new dwellings increasing by around 2 per cent per annum. As Chart 9 shows, new dwelling stock was running well above population growth for the past few years. The supply was so large in 2019 that there was constant fears of oversupply in new apartments. This year, that narrative is likely to be exacerbated as population growth is set to fall to around 0.5% (one third of its prior levels), much lower than the 1% growth seen through the late ’90s, creating a picture of oversupply.
Chart 9 Population and dwelling stock growth* (year –ended)

Source: Reserve Bank of Australia (Mar 2019). *Dotted lines represent forecasts.
This should lead to a weakening in mortgage approvals, particularly for investors, as it will be harder to have certainty around the investment implications of a property. Additionally, it should manifest itself via rents being weaker than usual since there is an oversupply of building, lower immigration, no international tourism and reports that short-term stay properties have been looking to lock in tenants leading to greater supply in the rental market. In fact, the recent ABS inflation statistics stated that “Rents recorded the first quarterly fall since the series commenced in 1972”.
Overall, this is one of the more concerning big picture ideas for housing over the next 12 months. A traditional source of demand from population growth will be slowing at a time when unemployment is high and the ability for Australians to buy housing is lower than usual.
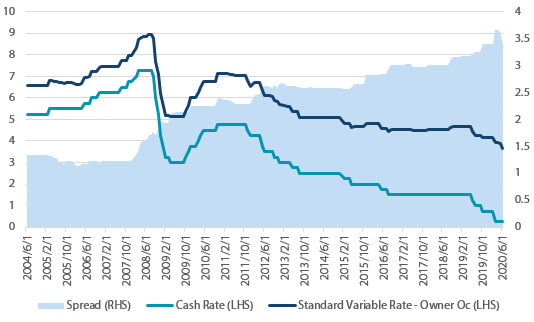
4. Interest rates
Interest rates have consistently fallen whenever the housing market showed any signs of stress. Chart 10 depicts this by showing only the months with negative house price changes against the cash rate. In 2008, 2011, 2015 and 2019, the house price declines stopped as the cash rate fell. This has been no different over the past few months, with the cash rate falling 0.5% this year. Unfortunately for the RBA, rates are at a level they perceive to be the lower bound (0.25%). Without moving into negative territory, the RBA has little room to continue easing via traditional methods. Hence the viability of this strategy, cutting rates to keep prices rising as seen over the past 10 years, looks like it could be coming to an end.
Chart 10 Australian house price index
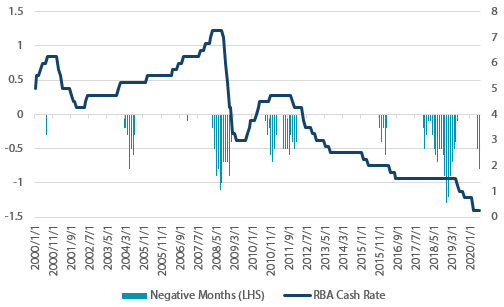
Source: Bloomberg, CoreLogic, Nikko AM
Focusing more specifically on the recent cuts, we need to understand just how much the recent rate cuts could benefit prices. The magnitude of rate cuts on house prices was explained by RBA research in early 2019, where they equated the price of a house as the rental benefit divided by the cost of owning the property. In simplistic terms, this is similar to pricing an annuity: the rent is your income stream and the user cost the discount rate.
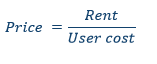
Here the user cost includes the average real variable mortgage rate, running costs, transactions costs and depreciation. And the research makes the following statement on the effects of falling rates:
‘At a user cost of 6 per cent we estimate that a sustained percentage point drop in interest rates would, in the long run, boost housing prices by 17 per cent, holding rents and other components of the user cost equal.’
——A Model of the Australian Housing Market, Reserve Bank of Australia (2019)
Since the RBA cut rates by 0.50% over the past three months, this would equate to a potential 8 – 10 per cent lift in prices. However, this overlooks the fact that rents are currently falling, so the benefit will not be as large since we are not, as a good economic model would say, ‘holding rents’ equal.
A simpler measure to see the effects of interest rates on house prices is to determine how the average borrowing size will be affected by falling mortgage rates. In Australia, the average household income is $1,652 per week, which equates to roughly $1,250 after tax. Assuming a person spends 40% of their post-tax income on mortgage repayments, this gives them the ability to service about $500 per week. Based on those calculations, here is the borrowing capacity under different interest rates on a 30 year loan, assuming the borrower pays $500 per week:
Chart 11 Borrowing capacity at different mortgage rates
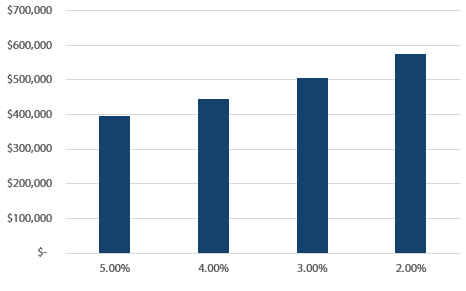
Source: Australian Bureau of Statistics, MoneySmart.gov, NikkoAM
A 1% reduction in interest rates would lead to about a 14% increase in borrowing capacity at current levels, which is not dissimilar to the estimate made above by the RBA above (under the user cost method). As the RBA has cut rates by 0.5% since the pandemic begun (excluding the cuts from 2019), this would imply that the average household could take on about $30,000 more debt this year. Assuming of course, that they have not lost their employment.
As Chart 12 shows, the mortgage rate is set to have fallen by about 1.50% over the past year, to finish at around 3%. In 2008, the mortgage rate fell a little over 3% and in 2011 around 2%. Despite far worse employment outcomes than in 2008 and 2011, there will be less support coming to the housing market via lower rates in 2020, limiting its typical upside.
Chart 12 Cash rate and mortgage rate
Source: Bloomberg, Nikko AM, Reserve Bank of Australia
While the recent rate cuts are a positive driver for the housing market, there is a looming question of whether it will be enough to offset the other negatives described above. When the RBA estimated the impacts on housing they moved rates and held all else equal. At the moment all else is not equal, meaning those estimates are higher than what we should now expect. We believe that it stands to reason that the RBA would want to cut more if they could, but given interest rates have hit the zero lower bound, they are reluctant to provide the normal amount of easing that would be required in these circumstances.
Where does that leave us?
Overall, these big picture drivers can be split into three broad categories – the ‘good’, the ‘bad’ and ‘it depends’.
The category of the good is the swift action taken from the RBA. With interest rates falling a little over 1% over the past 12 months, housing becomes more affordable. If all else were equal (note: all else is not equal) then prices would be set to rise over 15% from their mid-2019 levels. This action will help stave off some of the negative outcomes.
The category of the bad is the high unemployment and drop in immigration. Both of these indicators are pointing to weaker demand for housing. Australians who have lost their job will be far less likely to buy (and could become sellers), while the lower population growth means fewer people will require new housing over the next 12 months. Given Australia has some of the highest household debt and house price-to-income ratios in the world, it does raise questions about where the demand will come from.
The category of it depends is related to both the fiscal support and loan deferrals. At the moment, unemployment benefits are two to three times higher than they usually would be and close to 500,000 borrowers have had their payments deferred. The fact that these benefits have been extended, albeit at lower amounts, means some of the more negative outcomes may be avoided (or simply delayed). However, the reduction in in the size of unemployment benefits creates a far harsher environment for those who have been affected economically and will likely see many receiving less income than is required to meet minimum living standards.
When we come back to our question: how worried should we be? The answer to this question at the moment falls on government support and just how long it will last. So far, the government has reluctantly shown that it expects to continue these support measures with new restrictions and the banks have been given another six months to extend deferrals to those who can repay at the end. Hence, depending on how these support measures are changed, there is good reason to believe that the negatives will continue to outweigh the positives over the next 12 months as the expansionary polices are slowly unwound. This means house prices could fall further than the forecast 5 – 10 per cent that most expect over the short term and into the 10 – 20 per cent decline range. That certainly calls for more concern than the short term indicators would suggest.
Important Information
This material was prepared and is issued by Nikko AM Limited ABN 99 003 376 252 AFSL No: 237563 (Nikko AM Australia). Nikko AM Australia is part of the Nikko AM Group. The information contained in this material is of a general nature only and does not constitute personal advice, nor does it constitute an offer of any financial product. It does not take into account the objectives, financial situation or needs of any individual. For this reason, you should, before acting on this material, consider the appropriateness of the material, having regard to your objectives, financial situation and needs. The information in this material has been prepared from what is considered to be reliable information, but the accuracy and integrity of the information is not guaranteed. Figures, charts, opinions and other data, including statistics, in this material are current as at the date of publication, unless stated otherwise. The graphs and figures contained in this material include either past or backdated data, and make no promise of future investment returns. Past performance is not an indicator of future performance. Any economic or market forecasts are not guaranteed. Any references to particular securities or sectors are for illustrative purposes only and are as at the date of publication of this material. This is not a recommendation in relation to any named securities or sectors and no warranty or guarantee is provided.