The US has been deemed the “least dirty shirt” for the better part of a decade, rewarding those staying overweight as the rest of the world, and emerging markets (EM) in particular, has struggled to adjust from the imbalanced excesses of the prior decade. Today, the US is the dirtiest shirt in Covid-19 terms, while synchronized easing might just be creating the reflationary conditions for the rest of the world to thrive.
China is experiencing a V-shaped recovery having weathered Covid-19 remarkably well, while increased stimulus is helping to lift global demand. Europe has made a monumental step toward a fiscal union, and it is also benefiting from China demand and formidable stimulus at home. All is not necessarily fixed and Covid-19 certainly remains a threat, but future prospects for growth do look brighter.
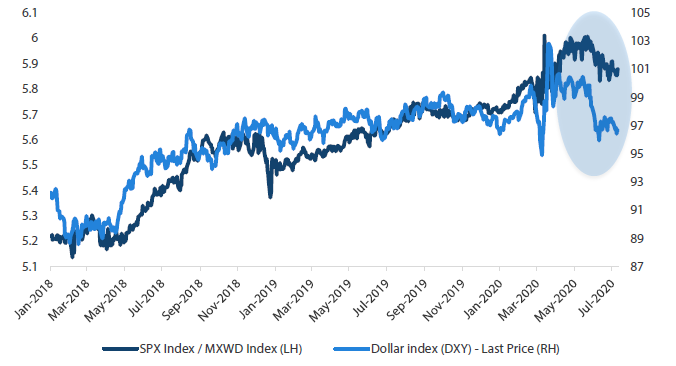
Certainly, EM loves liquidity and capital inflows, but a weaker dollar ensures that financial conditions remain easy and that the capital keeps flowing in and not out. Since May, US equities appeared to have rolled over in terms of the outperformance over the rest of the world and the quickly-retreating dollar is helping to reinforce this new dynamic. Is this a new trend? It is early to say but still encouraging for EM prospects.
Chart 1: US equities slipping with the dollar relative to rest of the world
Source: Bloomberg, July 2020
Asia: Covid-19 contained as China grows and lifts stimulus
In Covid-19 terms, Asia certainly appears to have gotten it right outside of pockets of stress in India, Indonesia and the Philippines. New clusters threatened a second wave in Singapore, South Korea and Beijing, but ultimately, through a combination of compulsory masks and tracing, efforts to re-contain the virus have worked, allowing economies to continue to normalise.
China eclipsed its 2019 economic high through a combination of targeted stimulus, mainly aimed at the private sector, which has helped to lift supply-side growth—albeit with the demand side still lagging. More recently, China stimulus has turned a bit more traditional in terms of old fashioned brick-and-mortar infrastructure, but without the same excesses of credit binges in the past.
The net impact of these developments is positive on an absolute basis and even better relative to other regions around the world. North Asia hardware technology continues to surprise to the upside, feeding into China’s new infrastructure development and the world’s insatiable appetite for computing power in a Covid-19 world. ASEAN benefits from improved China demand but travel restrictions will continue to plague the all-important tourism sector.
Asset Class Scores
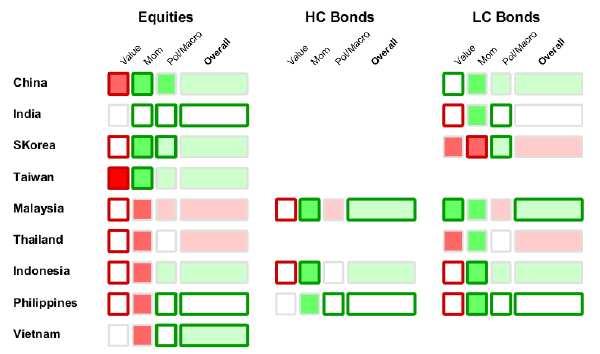
Score Summary: For each country and asset class, scores are represented by colours – white is neutral, green is positive and red is negative. The overall score is shown to the right with the underlying scores – value, momentum and political/macro – shown to the left. The border shows grey for no score change, while green shows positive and red negative.
The asset classes mentioned herein are a reflection of the portfolio manager’s current view of the investment strategies taken on behalf of the portfolio managed. These comments should not be constituted as an investment research or recommendation advice. Any prediction, projection or forecast on sectors, the economy and/or the market trends is not necessarily indicative of their future state or likely performances.
Bubbly China A-shares
China has been more careful with its stimulus, aimed to reduce speculation in favour of investing in the real economy, but large amounts of liquidity inevitably lifts asset prices. With China’s largely closed capital account, excess liquidity often flows into the property market. But as authorities have worked hard to minimise speculative flows, excess liquidity is finding its way into the A-share market.
At least historically, China has had a major problem with the boom-and-bust equity cycles brought by speculative retail flows: excessive speculative leverage would sow the seeds for a subsequent bust. Is this time different? We think so, mainly because China has learned its lessons and appears to be staying ahead of the speculative curve this time around.
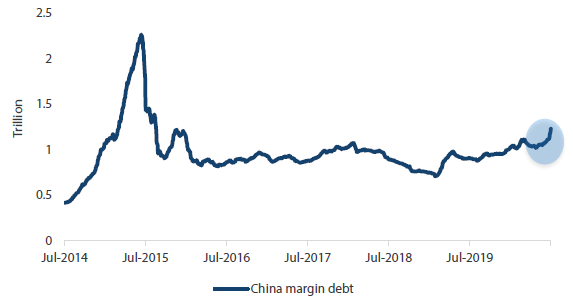
The degree of leverage reflected in margin accounts was massive back in 2015, and while margin accounts have risen as of late, it is still far from worrying levels. What’s more, authorities are already doing something about it.
Chart 2: China A-share margin debt
Source: Bloomberg July 2020
In early July, authorities indicated closer scrutiny of margin financing and days later announced zero tolerance for capital market “irregularities”, helping to instigate a 5% correction during the week that followed. It is not ideal for markets to be guided with a carrot and a stick, but fundamentals are strong, valuations are reasonable and a bit of added liquidity is always welcome.
Tit-for-tat and the important red line
The US continues to ratchet up pressure on China on various fronts, which in the worst case scenario could derail the Phase 1 trade deal. Our belief is that the US will continue to press close to the red line, but not cross it as both Presidents Trump and Xi need a Phase 1 trade deal.
However, Trump, who is slipping in the polls, is clearly applying pressure on China as a campaign tactic, so the risk might be that he becomes desperate and ultimately pushes China too far.
EMEA: Rolling with the punches
Eastern Europe and Turkey have been relatively successful in containing Covid-19, while Russia and South Africa clearly less so. From the standpoint of external macro risks, Russia looks better-positioned while South Africa and Turkey remain highly vulnerable in terms of their ability to fund external deficits.
Russian assets once again came under assault as US intelligence alleged (though disputed across agencies) that Moscow paid bounties to the Taliban for attacking coalition forces in Afghanistan. Given intelligence agency disagreement and China remaining firmly in focus, we see any major sanctions as a low probability event.
The more troubling risks in the region are with Turkey and South Africa. In the current liquidity-rich environment, markets focus less on macro imbalances, leading to worse policy and greater vulnerabilities. This quarter, South Africa was downgraded to now a firmly junk position, but it may have better cover than Turkey, which is stretching the limits of its imbalanced policies.
Asset Class Scores
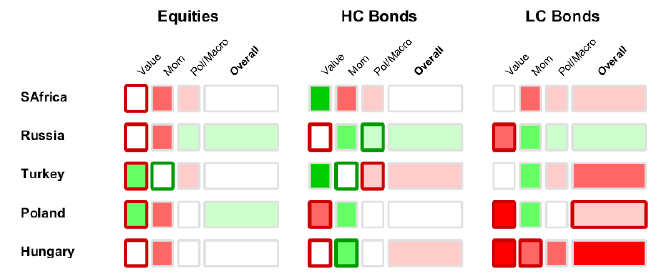
Score Summary: For each country and asset class, scores are represented by colours – white is neutral, green is positive and red is negative. The overall score is shown to the right with the underlying scores – value, momentum and political/macro – shown to the left. The border shows grey for no score change, while green shows positive and red negative.
The asset classes mentioned herein are a reflection of the portfolio manager’s current view of the investment strategies taken on behalf of the portfolio managed. These comments should not be constituted as an investment research or recommendation advice. Any prediction, projection or forecast on sectors, the economy and/or the market trends is not necessarily indicative of their future state or likely performances.
Turkey: Still a barometer of systemic risk
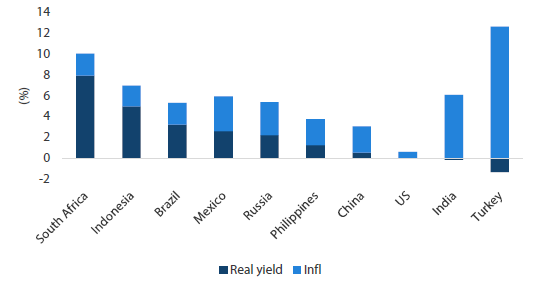
When liquidity is plentiful, the greatest beneficiaries are those countries that need it most to help fund external deficits. South Africa requires external funding of its large fiscal deficits, made worse by Covid-19. But Turkey is likely the riskier of the two given how far it has pressed policy to lift growth while leaving little to attract foreign investors to help fund its structural current account deficit.
The central bank has been cutting rates aggressively, desperate to spark its credit growth engine, under the premise that it can do so because inflation is falling. However, while the central bank forecasts a year-end inflation rate of 7.4%, analysts do not agree, with most projecting inflation to remain in the double digits where it is today. As it stands, negative rates to not bode well for attracting foreign investors.
Chart 3: Turkish bonds among most negative real yields
Source: Bloomberg, July 2020
Turkey has dangerously low foreign exchange reserves with which to defend its currency and has been forced to enact capital controls, such as limiting foreign deposits in banks. Policies have also been set to punish investors with prohibitively high hedging costs. The result: capital is being pushed away, not drawn in. So eventually there will be a breaking point, in our view, requiring yet another economic adjustment, including letting the currency fall.
So far, policymakers are strongly resistant to any form of adjustment given President Erdogan’s slipping popularity and the failure of the last major adjustment just two years ago in 2018. Policymakers are also strongly resistant to an IMF bailout, given the reform strings attached.
So what’s next? It is hard to say because seemingly unsustainable policies can be maintained much longer than one would ordinarily imagine. For now, we will need to watch closely whether these cracks turn to fissures, as such a development would likely metastasize across other weak EMs.
Latin America still challenged by the pandemic
Covid-19 hit Latin America (LatAm) particularly hard through a combination of initial denial and blundered efforts to contain the virus, which has further shaken its already weak political institutions. Chile and Peru would be considered among the most stable of the lot, but even there, populism is starting to win the upper hand to push through bad policies.
The silver lining for the region is renewed demand for the commodities that it exports, mainly from China where stimulus has been upgraded to include a fair bit of traditional infrastructure that requires raw materials.
The lift in commodities has raised asset prices from extremely depressed levels. Now the question is whether a rally can be sustained despite the ongoing Covid-19 crisis that will continue to stunt domestic demand. Much will depend on Chinese demand and the direction of the dollar, in our view.
Asset Class Scores
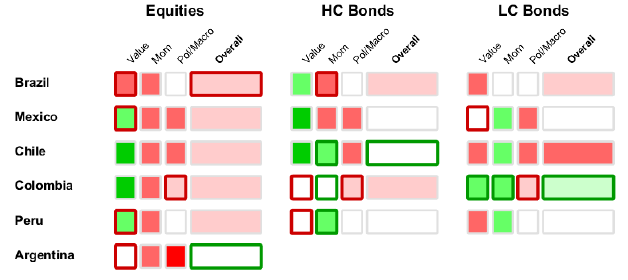
Score Summary: For each country and asset class, scores are represented by colours – white is neutral, green is positive and red is negative. The overall score is shown to the right with the underlying scores – value, momentum and political/macro – shown to the left. The border shows grey for no score change, while green shows positive and red negative.
The asset classes mentioned herein are a reflection of the portfolio manager’s current view of the investment strategies taken on behalf of the portfolio managed. These comments should not be constituted as an investment research or recommendation advice. Any prediction, projection or forecast on sectors, the economy and/or the market trends is not necessarily indicative of their future state or likely performances.
Commodity support and weak dollar catalysts for inflows?
We described the US as the “dirtiest shirt” in Covid-19 terms, but LatAm does not look any better. However, improved external demand does have the potential to reflate the region, particularly if it is coupled with a weaker dollar.
For the region, the last decade is almost the mirror image of the decade that preceded it. In the EM “go-go” days of the 2000s, when China was gobbling up commodities to sustain its double-digit growth rate, LatAm basked in easy money, which led to expensive currencies, misallocated capital and loads of corruption.
When China credit finally tightened in 2011, ending the decade-long investment boom, commodities collapsed and so did commodity-exporting economies. Economic busts are positive for the reforms they usually induce; Brazil has executed the most aggressive reform agenda in the world. However, capital has stubbornly yet to flow, which is why we look to the recent support for commodities and a weak dollar as the potential catalyst for capital to return.
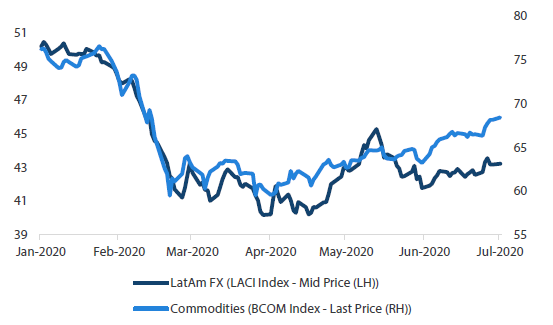
There is no doubt that commodities prices still largely determine the price of the regional currencies, which are intertwined with the flow of capital as well as the dollar. Easy monetary policy from the US Federal Reserve (Fed) and easy fiscal policy from China is a powerful combination that could spark reflationary conditions to attract capital flows.
Chart 4: LatAm currencies versus commodities
Source: Bloomberg, April 2020
The sceptics will say that China stimulus to date is insufficient to lift demand much outside of China. Stimulus has picked up but even more important than the size of the stimulus is the synchronization of easy policy around the world. In 2015, the massive stimulus temporarily lifted external demand, but it could not be sustained given the Fed’s efforts to tighten monetary policy. Today, synchronized easy policy between China and the Fed is likely the more sustainable reflationary formula, which might be just what LatAm needs to pull it out of its capital-starved doldrums.


