

The opportunity
This short paper outlines our belief of why a stand-alone allocation to Asian bonds could significantly enhance the investment outcomes for your portfolio. In our view, directly allocating to Asian local currency (LC) Bonds and/or US dollar-denominated hard currency (HC) bonds could provide the following benefits to investors:
Invest into a fast-growing, large and overlooked regional economy
Asia is one of the fastest growing regions in the world. This growth presents a compelling argument to invest in Asian bonds. The growth of Asia ex-Japan economies, underpinned by China’s ascent, has significantly outpaced that of developed economies.
In 1998, the region’s share of global gross domestic product (GDP) was 9%; currently, it is around 35%.
Global bond indices do not reflect the significant size of Asian economies. Despite representing a third of the global GDP, the Asian market representation is low; for example, it accounts for just 7% of the Bloomberg Barclays Global Aggregate Index. This is of course due to the construction of such indices that lead to greater representations of the most indebted issuing country and regions.
Investors should also look beyond classifying Asia within emerging markets, even though this has been a typical way of gaining exposure to the region’s bonds. The size, strength and quality of the Asian bond markets do not necessarily deserve that label. A stand-alone allocation makes more sense to us.
We expect the depth, breadth and diversity of the Asian bond markets to further increase from where we are today. Intra-regional flows, a requirement for more diverse funding, coupled with increasing issuer sophistication, are factors that will fuel these characteristics, in our view.
Higher yields and spreads
Asian local government bonds provide relatively attractive carry versus US Treasuries and other developed market government bonds. Despite yields declining to historic lows as the world deals with the global pandemic, real yields in Asia remain attractive compared to those in developed economies where a significant portion have negative yields (more than 30% of Bloomberg Barclays Global Treasuries Index). Similarly, Asian credits also offer a credit spread premium over US and Euro credits of similar quality.
Better risk-adjusted performance
Asian bonds have delivered better risk-adjusted performance relative to global and other regional benchmarks. Asian local currency bonds have shown better Sharpe ratios than global bond benchmarks such as the Bloomberg Barclays Global Aggregate, Global Treasuries and Global EM Government Bond indices. Similarly, Asian Credit, both investment grade and high yield, has delivered strong returns with relatively lower volatility than both developed market and emerging market credits. Domestic and regional investor growth has provided a strong support for both LC and HC bonds in the region.
Active management opportunities
With a diverse and growing investment universe in Asian bonds, our highly experienced Fixed Income team manages a wide range of active Asian fixed income portfolios. They are present on the ground and understand the opportunities and risks in Asia. It is our belief that there are great opportunities for specialist investment managers in the dynamic Asian market. We explore Local Currency and Hard Currency bonds further in the remainder of this paper. We would be pleased to discuss our case for stand-alone allocation to Asia Bonds with you. A contact email and phone number can be found at the end of the paper.
Asian local currency bond market
The Asian local currency (LC) bond market comprises primarily of domestic LC-denominated bonds that are mostly issued by sovereigns and major quasi-sovereign issuers. We believe that an allocation to this market will provide investors with adequate exposures across the different bond and currency markets in the region as well as relatively attractive carry versus US Treasuries (USTs).
Market size has grown significantly to USD 18 trillion
The Asian LC bond market has grown significantly over the years to the current size of about USD 18 trillion1 as regional governments have pushed for market development after the Asian Financial Crisis in the late 1990s. Whilst overall exposure is mostly to Asian sovereigns and quasi-sovereigns, an emerging local currency corporate bond market also exists. The asset class continues to develop and evolve owing to strong domestic support and relatively high savings rates.
Large foreign exchange reserves make currency volatility risks more manageable
As with domestic investors, who have grown to recognise Asian LC bonds as an attractive asset class, foreign investors’ participation in these bonds have increased in recent times. Asian governments continue to reform local markets and improve foreign investor rules, particularly in China. The region’s large foreign exchange reserves allow Asian countries to more easily manage currency volatility risks in case of large portfolio investment outflows.
Small representation in the global index despite holding a significant share in the economy
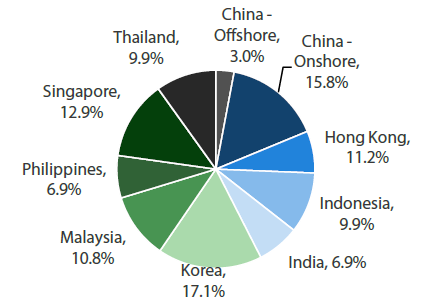
Although the region accounts for 35% of the global economy, the Asia ex-Japan’s share in global bond benchmarks is still relatively small. For example, in the Barclays Global Aggregate Bond Index, the Asia ex-Japan region’s LC bonds is only about 7.0% of the index (see Chart 1). Global Emerging Market Debt, on the other hand, includes Asian bonds in a more significant way. Still, not all regional bonds are included as there are some Asian countries that are already classified as developed markets. A regional allocation to Asian LC bonds, however, can then provide investors with adequate exposures across the different bond and currency markets in the region.
Chart 1: Country weights (%) of LC bonds in the Bloomberg Barclays Global Aggregate Bond Index
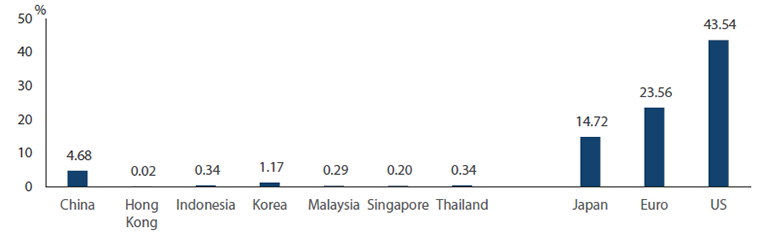
Source: Bloomberg, Barclays Live, as of 30 June 2020.
Diversified investment grade sovereigns
Diverse group of economies boasting investment grade ratings
The Asia ex-Japan region is comprised of a diverse group of economies and is one of the fastest growing regions in the world. In terms of credit quality, countries with well-developed local bond markets have all been assigned investment grade credit ratings (see Table 1). Although the COVID-19 global pandemic has impacted growth significantly for the region as countries fight to contain the health and economic crisis, aggressive monetary and fiscal policy measures have been used to contain the economic impact of the pandemic.
Table 1: Credit ratings and GDP growth forecasts
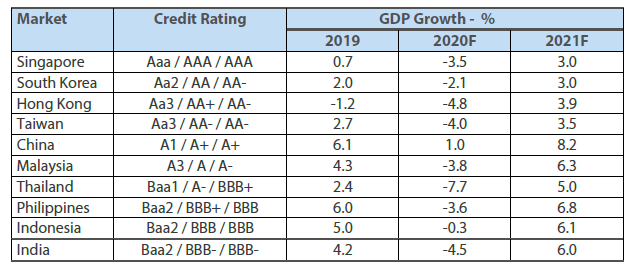
Source: Bloomberg, IMF World Economic Outlook, April 2020 and World Economic Outlook Update, June 2020.
Generally low debt due to governments' prudent fiscal stance
Asia’s debt as a percentage of GDP has been generally low compared to other parts of the world as shown in Chart 2. This is because Asian governments have for the most part have taken a prudent fiscal stance and avoided taking on excessive debts.
Chart 2: Public debt as percentage of GDP (%)
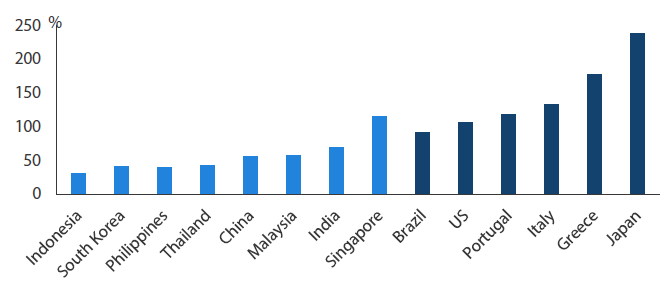
Source: Bloomberg, December 2019.
More diversified allocation factoring market liquidity, credit quality and accessibility
The Markit iBoxx Asian Local Currency Bond Index (ALBI), the regional Asian LC index, covers about USD 6 trillion of outstanding bonds. The index is dominated by sovereign and quasi-sovereigns, and the two groups comprise about 93% of the overall iBoxx ALBI allocation (Table 2). Asian LC bond indices are constructed not just on market size but also on other factors such as market liquidity, credit quality and accessibility. This leads to a more diversified allocation that takes into consideration important factors when investing in Asian LC bonds (see Chart 3).
Table 2: Asia LC bond market profile—Markit iBoxx Asia Local Bond Index (ALBI)
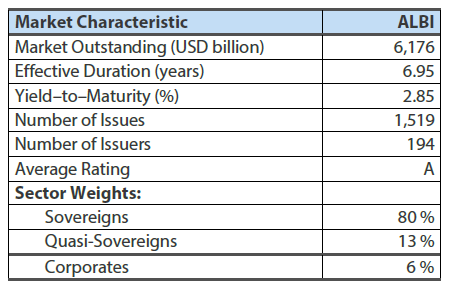
Source: Markit iBoxx, as of 30 June 2020.
Chart 3: Markit iBoxx Asia local bond index (ALBI) by country
Source: Bloomberg, Markit iBoxx, Nikko AM Asia, as of 30 June 2020.
Higher yields
Real yields in Asia remain more attractive compared to G3 economies
Asian local government bonds provide relatively attractive carry vs USTs and other developed market government bonds (see Chart 4 and 5). Despite yields declining to historic lows as the world deals with the global pandemic, real yields in Asia remain more attractive compared to those in G3 economies. A significant portion of the global bond markets now yield below zero, with about 32% in the Bloomberg Barclays Global Treasuries Index having negative yields as of end May 2020.
Chart 4: 10-year benchmark yields (%)
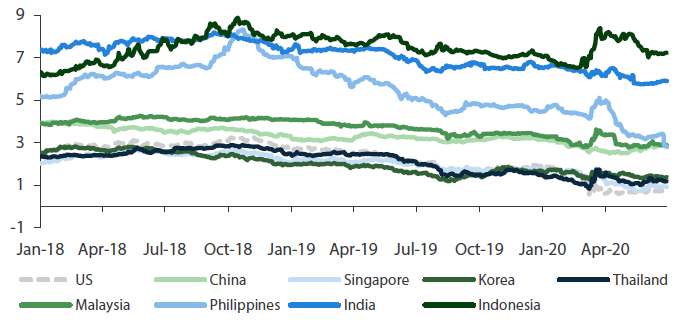
Source: Bloomberg, 30 June 2020.
Chart 5: Real Yield Differentials (10-year yields)
Benchmark 10-year yields less inflation, equally-weighted average across countries.
Source: Nikko AM, Bloomberg, 30 June 2020
Better risk-adjusted returns and diversification
With attractive yields and exposure to relatively strong currencies, the ALBI, the Asian LC bond index, has delivered better performance after the Global Financial Crisis as compared to global bond benchmarks that primarily invest in local government bonds, such as the Bloomberg Barclays Global Aggregate and Global Treasuries indices (see Table 3). Compared to the rest of the local currency global emerging markets (EM), Asian LC bonds have significantly lower volatility, highlighting their safe haven quality within EM (see Chart 6).
Table 3: Risk-adjusted performance of ALBI vs Global Aggregate and Global Treasury, Global EM Index (Jan 2009–Jun 2020)
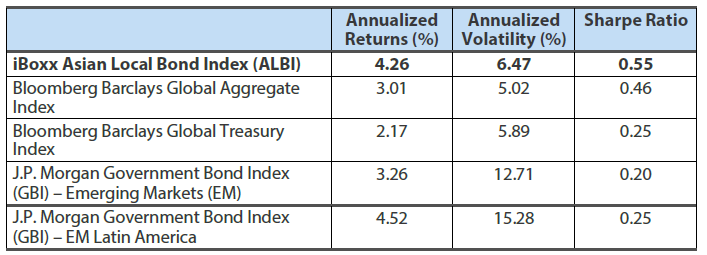
Source: Nikko AM, Bloomberg, HSBC/Markit, JP Morgan, in USD Unhedged terms, from January 2009 to June 2020.
Risk-free returns are based on JPM 1M LIBOR Index
Chart 6: Asian LC bonds performance: Returns, volatility and Sharpe Ratio (Jan 2009 – Jun 2020)
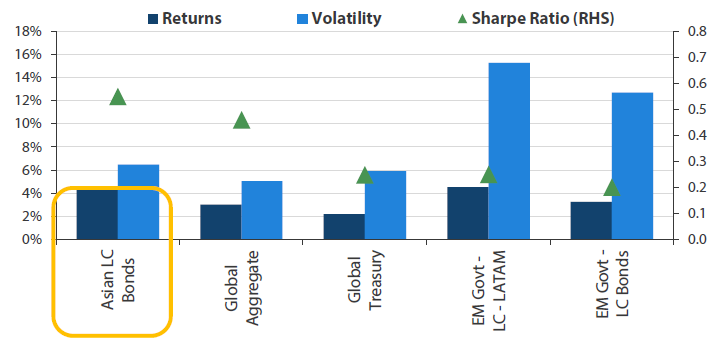
Source: Nikko AM, Bloomberg, Markit, and JP Morgan. From January 2009 to June 2020. In USD Unhedged terms.
Asian LC bonds also provide diversification benefits for a global bond investor given their different market characteristics relative to G3 bond markets. As Chart 7 shows, adding Asian bonds into a UST, Japanese government bond (JGB) or Euro Treasury portfolio would improve the portfolio return-to-risk profile given the lower correlations and higher yields. For instance, as of the end of June, a Euro Treasury portfolio would give a return of 3.3%, with 9.1% annualized volatility, in the last 10 years in US dollar terms. After allocating Asian bonds (50% allocation) into the portfolio, it would give a return of 3.6%, with 6.9% annualized volatility during the same period.
Chart 7: Global government bonds with Asian bonds performance and risk profile
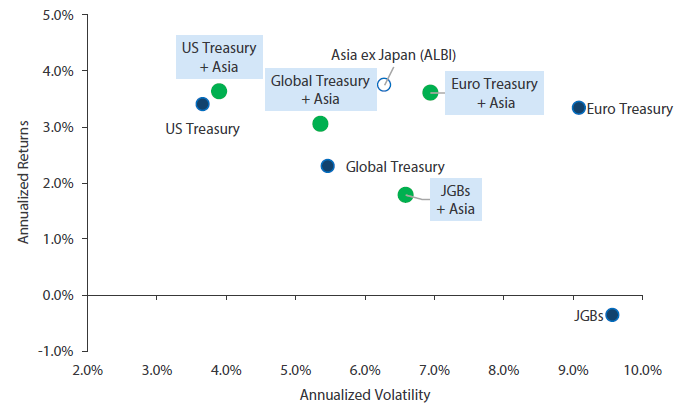
Source: Nikko AM, HSBC, iBoxx Markit, Bloomberg Barclays, as of 30 June 2020. Performance data in USD unhedged terms, for the last 10 years ending June 2020. Equal allocation when Asia local currency bonds are combined with Global Treasury and G3 Treasury bonds performance.
Asian hard currency bond market
The Asian HC bond market is primarily comprised of USD-denominated credits from Asian issuers. Issuers from across the region access this market when they need to issue in size. These issuers include not just corporates but also sovereigns and many sovereign-related issuers. This is where investors in Asian credits usually allocate, as they have access to larger issuances, greater number of investor participants and better liquidity. Credit ratings are also based on global credit ratings.
Market size totalling USD 1 trillion comprising a vast range of issuers
Asian credits for the most part refer to the HC bond market, comprised of USD-denominated bonds issued by Asia ex-Japan issuers. The market has crossed the USD 1 trillion mark in terms of market outstanding in 2019. It has grown in depth, breadth and diversity, with more than 600 investment grade, high yield as well as non-rated issuers from 17 markets or economies in the region. Besides the region’s strong fundamental growth, technical factors supporting this asset class include regional demand with the rise of the “local bid”. As regulations such as capital flows, foreign investor access, currency regulations and credit rating frameworks can be different across local credit markets, for international investors the offshore USD-denominated Asian credit market is the easier and more accessible route to gain exposure to Asian credits.
Chart 8: JP Morgan Asia Credit Index (JACI) Market Capitalisation (USD Billion)
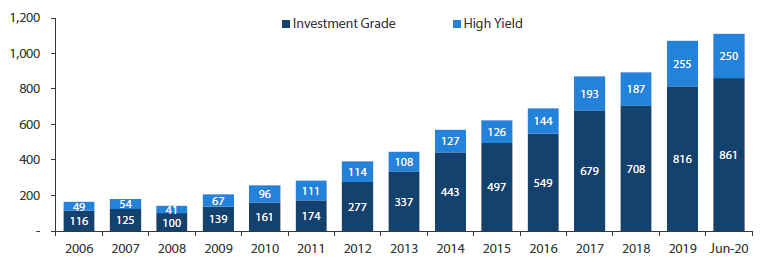
Source: JP Morgan, as of 30 June 2020.
Customising country and sector allocations
Since 2011, market issuance has been led by Chinese issuers—an understandable trend, given the sheer size of China’s economy and its increasing integration into the global financial markets. Chinese issuers have increasingly tapped the offshore market in recent years and their issuance is moving towards the high share of the Chinese economy in the Asia ex-Japan region. Although in the long-term, we expect dominance of the Chinese issuers to pare over time as China’s growth moderates while issuers in other domiciles and sectors increase their offshore funding. The largest industry sectors in Asian HC credits are sovereigns, quasi-sovereigns, financials, property, technology and oil & gas sectors. To address investors’ concerns on country or sector weights (e.g. China allocation) when investing in Asian credits, these can be mitigated by using diversified benchmarks or by customising the country and sector allocations.
Table 4: Asia HC (USD-Denominated) credit market profile
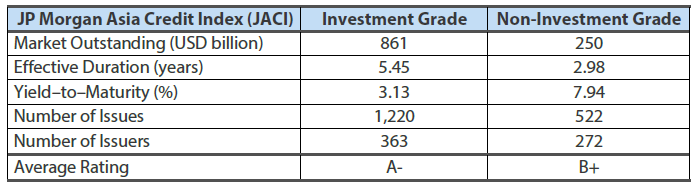
Source: JP Morgan, as of 30 June 2020.
Region’s fundamentals remain supportive
Asian credits generally of higher credit quality relative to their EM counterparts
Asia ex-Japan is the fastest growing region in the world. This not only supports the income to repay debt but also fuels funding needed for expansion. The clearest example of this is China. For China to fund its rapid growth, it has become a key supplier of debt issuance (both in local currency and USD). At the same time, given its high savings rate as a percentage of GDP, it is also a key source of demand for debt as local capital seeks appropriate investments. Although exposed to the US-China trade war, credit fundamentals in the country have improved in recent years. The containment measures to stem the coronavirus outbreak are likely to have a deep, if temporary, impact on economies globally. The credit fundamentals of corporates, financial institutions and even sovereigns are likely to weaken. Downward rating migrations are inevitable as a result. The long-term fundamentals of Asia remain intact despite the severe near-term challenges to growth where we see strong positive policy responses from governments in the region. Asian credits, many of which are connected or are strategically important to central governments, generally have higher credit quality than their counterparts in EM (see Chart 9 and 10).
Chart 9: EM debt vs US and European investment grade – Net leverage comparison
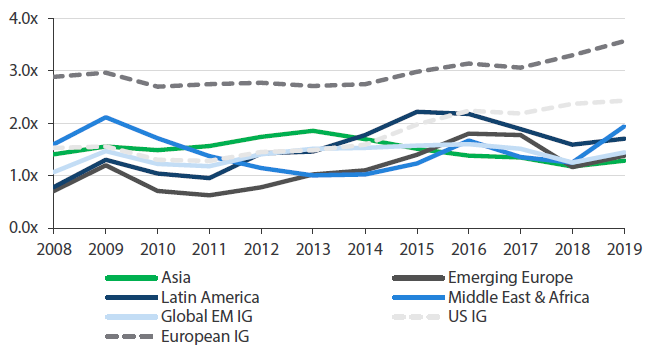
Source: JP Morgan, Emerging Markets Corporate Strategy Presentation, June 2020.
Chart 10: EM debt vs US & European high yield - Net Leverage Comparison
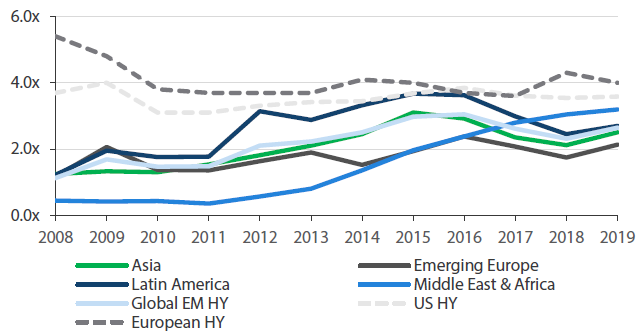
Source: JP Morgan, Emerging Markets Corporate Strategy Presentation, June 2020.
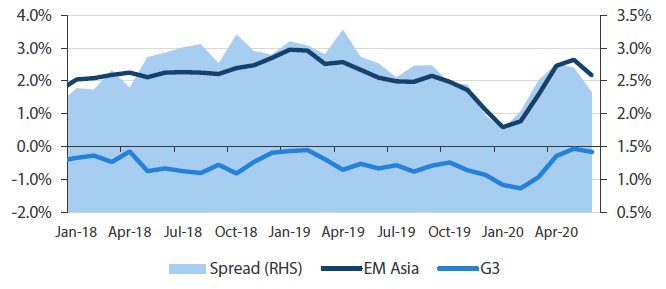
Asia spread premium
Asian credits saw extreme volatility driven primarily by the global coronavirus outbreak. The swing in credit spreads valuation might see potential upside once the virus outbreak is contained and economies start to recover. For medium to long-term investors, this could be a good entry opportunity, in our view, as Asian credit spreads have widened significantly. Regional credits still offer an attractive Asian credit spread premium over US credits of similar quality (see Chart 11 and 12).
Chart 11: Asia credit investment grade vs US & Euro investment grade - Credit spreads (in bps)
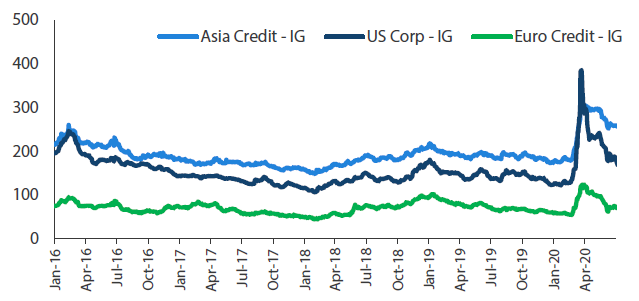
Source: JP Morgan, as at 30 June 2020.
Chart 12: Asia credit high yield vs US & Euro high yield - Credit spreads (in bps)
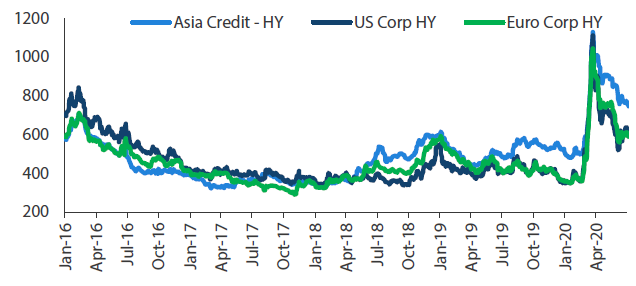
Source: JP Morgan, as at 30 June 2020.
Strong Technical Support
The rise of the “local bid” - Asian investors bought 78% of own debt in 2019
Besides the Asian region’s strong fundamental growth, technical factors supporting this asset class include regional demand with the rise of the “local bid.” We believe that strong regional demand will continue for Asian credits, which remain a relative global safe haven compared to other EM credits. Increasing wealth in the region provides strong technical support to the market. A critical difference between Asia and other EM regions is the percentage of local ownership. Unlike Latin America (LATAM) or the Middle East, which only bought 9% and 20%, respectively, of their own debt issuance last year, Asia investors bought 78% of their own debt in 2019 (see Chart 13). This helps dampen volatility in the Asian debt market in a significant way.
Chart 13: Ownership of EM debt by region
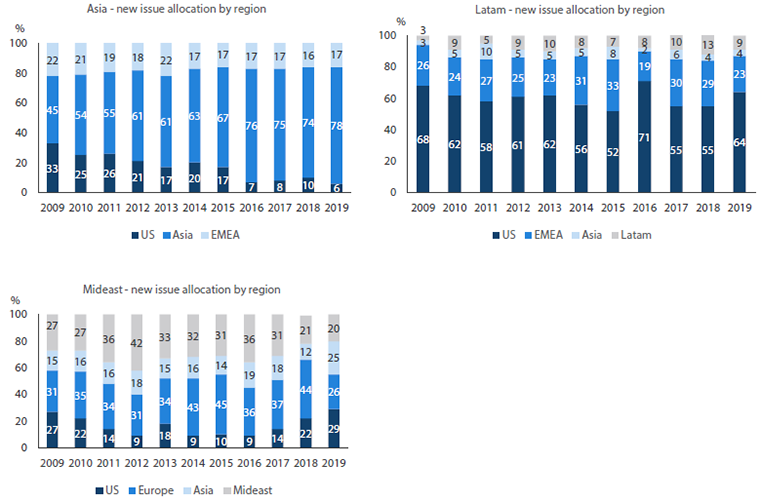
Source: JP Morgan, Emerging Markets Corporate Strategy Presentation, February 2020.
We expect Asian investors to continue to diversify into the USD and non-local fixed income papers. This bodes well for USD-denominated Asian credits. The search for yield will also support demand for Asian offshore credits as they tend to be larger and more liquid when compared to those available in the local currency credit markets. These technical factors should support the supply growth in the Asian offshore credit segment. At the same time, the risk of Renminbi (RMB) weakness can lead to rising demand from onshore Chinese investors for USD-denominated China assets, which have been a key contributor to the local Asia bid.
Better risk-adjusted returns
Following the Global Financial Crisis, Asian credits have delivered strong returns with relatively lower volatility (see Chart 14). Asian credits remain a relative global safe haven compared to other EM credits. The strong technical support for the region has supported Asian credits especially during high market volatilities. Looking ahead, we expect the market to continue to evolve as intra-regional investment flows continue to grow, funding needs become more diverse and issuers become more sophisticated.
Chart 14: Asian credit performance in USD terms: Returns, volatility and Sharpe Ratio (Jan 2009–Jun 2020)
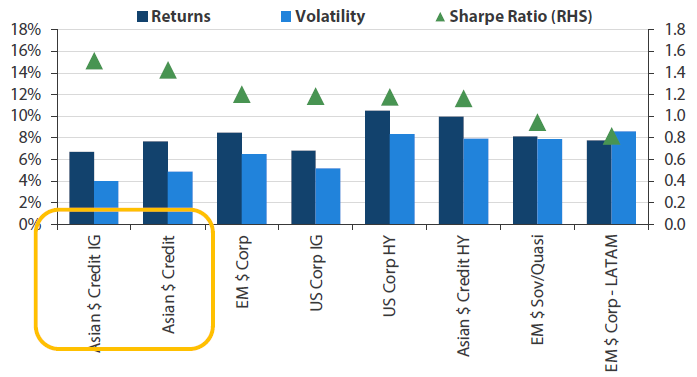
Source: Nikko AM, Bloomberg, Markit, and JP Morgan. From January 2009 to June 2020. In USD Unhedged terms
Nikko AM’s vast experience in managing Asian bonds
Nikko AM has a long history of managing Asian Fixed income with more than 30 years of experience investing in the market. We have one of the largest dedicated Asian Fixed Income teams, with 14 investment professionals averaging 14 years of experience in Asian markets. Members of the team come from multi-national backgrounds, and this allows us to understand and converse in local languages and diverse cultures within the region. Our portfolio managers and research analysts have honed a strong appreciation for the idiosyncratic characteristics of individual countries and sectors while successfully navigating our funds through various market cycles.
Our team is also present on the ground and understand the idiosyncratic risks of individual countries, sectors and issuers within Asia. Investing with an Asia-focused manager would allow generation of investment ideas as they are able to provide alpha both from a top-down and bottom-up perspective given the specialisation and a deeper understanding of the local markets and the underlying issuer.
Nikko AM manages different strategies invested in regional and single-country strategies in Asian bonds. With our team focused on Asian fixed income, we are able to customise investment strategies for institutional and retail investors.
- Regional Asian LC bonds — Our Asian LC bonds strategy invests in the domestic bond markets in Asia. Our investment managers have been covering and analysing China’s bond and currency markets given that the regional Asian LC bond benchmarks already include those of China.
- Single country Asian LC bonds — These strategies include RMB, Singapore dollar (SGD) and Indonesian rupiah (IDR) bonds. In 2010, we launched one of the first offshore RMB bond funds, which has since obtained a strong track record and decent inflows. Our onshore RMB bond fund was launched in 2014 through our RQFII quota and was one of the first in Singapore to access the onshore RMB bonds. Our presence in these markets covers not just active but passive strategies as well. Nikko AM was the first to launch an exchange traded fund (ETF) in Singapore in 2005, which was the ABF Singapore Bond Index Fund. And in 2018, we launched the first local currency corporate bond ETF in the Asian region—the Nikko AM SGD Investment Grade Corporate Bond ETF, which invests in LC bonds in the SGD market.
- Asian HC bonds (investment grade and high yield credits) — This strategy provides investors with exposure to a diversified universe of Asian sovereign and corporate issuers in the USD-denominated market. Nikko AM invests in the full Asian HC credit universe; we manage strategies that focus only on Asia Credit Investment-Grade bonds and on Asian High Yield only credits. The team also manages a composite strategy in Asian credit—our Asian corporate bond strategy—that invests in both investment-grade and high-yield credits. We are able to customise to client requirements to address specific client investment guidelines as well.
Our investment process seeks to deliver returns through multiple sources of alpha, utilising both top-down and bottom-up strategies. Our research approach utilises our proprietary Fundamental, Valuation and Technical framework to distil the top-down and bottom-up perspectives. Our Internal Credit Rating model, which Nikko AM has used since 2006, has been time and stress tested for its robustness. The Credit Research Team assesses issuers independently of external rating agencies, and the model is our first line of defence in managing credit risks. Risk management is embedded in our processes, and this dynamic iterative process is used to assess all risks.
Appendix
Appendix 1. Top 20 Issuers in the Asian Local Currency Bond Market (ALBI, 30 Jun 2020)
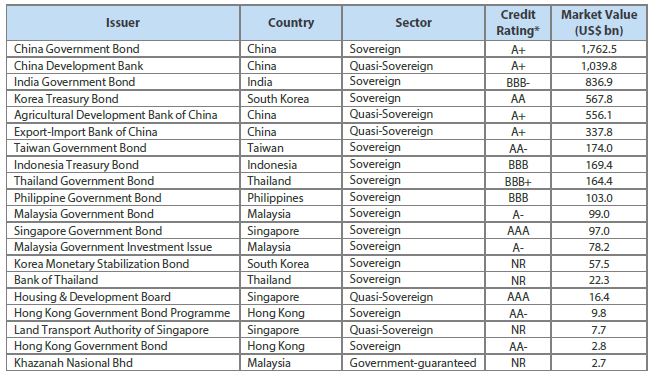
Source: IHS Markit, Nikko AM calculations. As of 30 June 2020. Based on outstanding bonds included in the index. *For split-rated issuers, median of S&P, Moody’s and Fitch ratings.
Appendix 2. Top 20 Issuers in the Asian Hard Currency Credit Market (JACI, 30 Jun 2020)
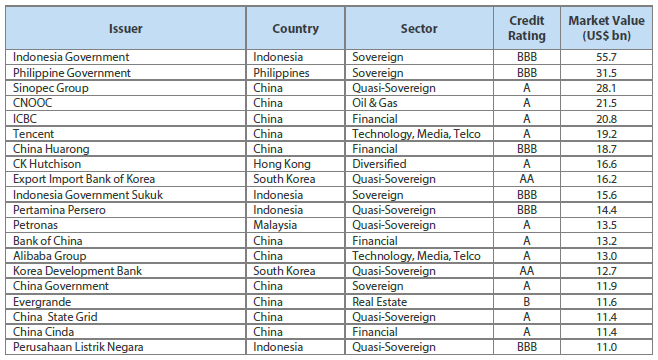
Source: JPMorgan, Nikko AM calculations. As of 30 June 2020. Sector and credit rating classifications are from JPMorgan.
Footnote
1Source: AsianBondsOnline (Asian Development Bank) except for India (Bank for International Settlements, Securities and Exchange Board of India) and Taiwan (Central Bank of China), as of December 2019.
