Introduction
COVID-19 battered retail real estate names as tenants were forced into lockdown and activity was halted. It also compressed social trends that ordinarily would have taken years to evolve into the space of a few months. Shoppers who traditionally shunned the online offering found themselves ordering online as shopping centres shutdown and fear set in. The tenant base that was becoming increasingly militant in their engagement with landlords accelerated their assertiveness when renegotiating their leases. The market reacted violently with the listed retail real estate stock prices underperforming the index massively since March and trading at roughly half their stated net tangible assets (NTA). While consumers may be heading back to the shops, there remains an air of uncertainty as to how rents will look like in the future as landlords continue to negotiate with tenants. Whilst we think the near-term is likely to remain volatile and the headlines negative for some time, as tenants successfully get landlords to capitulate on rent cuts, we think the correction has become an overreaction making the risk-reward for this sector more attractive.
The calm before the storm
Before the onset of COVID-19, the Australian retail market was arguably over-rented as signified by its high occupancy cost ratios and persistent negative re-leasing spreads across the major operators. Retail was already under pressure due to the impacts of ecommerce. For almost a decade, rents on a dollar per square metre basis for specialty retailers have, on average, remained broadly flat for non-CBD locations. The average retail operator has expanded revenue largely by:
- Developing new retail space, and
- Relying on the strength of its CBD assets.
However, these growth levers look to have diminishing outlooks. Deloitte estimates only 0.6sqm per capita of additional retail space will be added per annum over the next three years compared to an average 1.7sqm per capita over the past 25 years as a result of retailers consolidating store numbers. The listed space is no exception as development pipelines across the major operators have largely evaporated in FY20 compared to prior years. As long as borders remain closed, CBD assets will suffer due to the large proportion of tenant sales that are derived from tourism.
These challenges and thematic headwinds have contributed to deteriorating rental growth for the listed operators and as a result consistent underperformance of their stock over the past four years.
Chart 1 Commercial rents per square metre, Sydney vs Melbourne

Source: Colliers, Credit Suisse
The widespread impact of COVID-19 on retail assets
The impact on retail assets due to COVID-19 looks to be significant as rents are potentially rebased and asset values written down. During the lockdown, tenants have been forced to strengthen their online channels as well as rethink their physical store footprint. In our conversations with retailers, a significant proportion list accelerated store rationalisation and more aggressive rent negotiations with landlords as the norm going forward.
COVID-19 could potentially force a resetting of rents to a lower rent cost to tenant revenue ratio. Whilst there has been a lack of retail asset transactions to give the valuation firms evidence to write down asset values aggressively, we have noticed a behavioural shift when speaking to these valuers who are now more ready to rely on their discounted cash flows (DCFs) as well as overlaying their own assumptions onto the final value rather than largely relying on transactions as they had done so in the past.
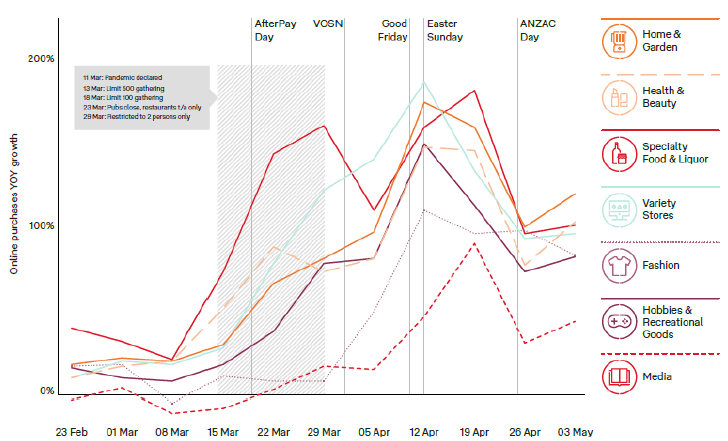
Australian shopping habits have also changed during COVID-19. Australia Post data shows March online spending accounted for 12.3% of total retail spend vs 11.3% for the same time last year. Growth in April was even more pronounced as online goods spend grew by 95% year-on-year. The current debate is fierce on whether this is transitory or to stay. We cannot say for certain, however current uncertainty is definitely being priced into the stock prices of listed retail assets.
Chart 2 Buyer behaviour

Source: Inside Australian Online Shopping, 2020 eCommerce Industry Report, Australia Post
Looking beyond tomorrow
Precedents to guide our thinking during this time are virtually non-existent, however the rapid growth of the Chinese ecommerce market in the early 2000s does offer some clue. Whilst there were many contributing factors to the rise of ecommerce and the emergence of players such as JD.com and Alibaba, commentators do point towards SARS as a major driver. If this experience translates to Australia in a similar fashion, then we could expect an accelerated and maintained erosion of brick and mortar sales and, in turn, the rents tenants will pay.
That said there is generally a price for everything. The current share prices of Vicinity (VCX) and Scentre Group (SCG) implies a tremendous resetting of rents across the board as well as a sizeable negative revaluation of asset prices of between 30 – 40%. Whilst we agree that store footprints will consolidate and rents will be cut, our view is that most of this downside has already been compensated via the deep discounts the stocks are trading at.
Some of the more pessimistic viewpoints around the big uptake of online during COVID-19 being responsible for the demise of brick and mortar also don’t seem to hold given the strong retail performance and foot traffic resurgence seen once the more onerous lockdown restrictions were lifted. This suggest to us that physical retail will always have a place even after COVID-19. The risk is around what the sustainable rents are, which we argue has already been taken into account by the market price.
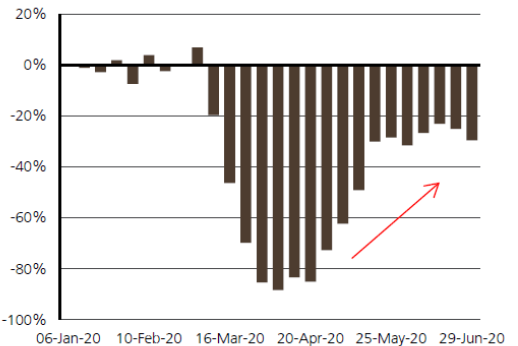
Chart 2 Shopper Trak: Latest data point was 6 July where footfall was down 29% year-on-year…

Source: ShopperTrak, UBS
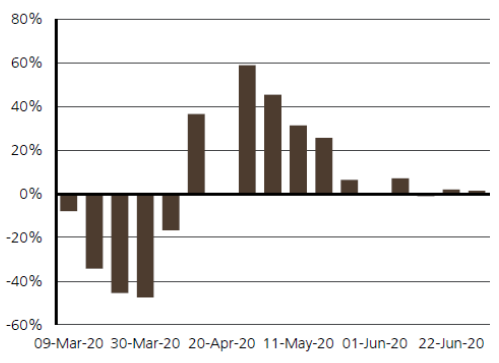
Chart 3 …and up ~1.4% week-on-week

Source: ShopperTrak, UBS
Another factor that gives us comfort in stepping into the retail stocks at these prices is the inherent value of the land of the assets, which could potentially be repurposed to residential or office if rents drop far enough to become economically suboptimal. Analysis by Morgan Stanley and Goldman Sachs shows that the current implied land price of SCG is lower than if the land was converted to alternate uses. Whilst we are cognisant that (1) the assumptions made are very high level and may have changed in the current market conditions, (2) razing large swathes of the portfolio would not be realistic, and (3) councils would likely object to their local shopping centre being removed, this does suggest that there is a measure of downside protection offered to current prices.
Even if the scenario of SCG’s portfolio being taken over to be repurposed remains largely academic, it’s likely that while the market is unwilling to pay for retail assets, at the margin there will be some retail assets that will (maybe partially) repurpose to alternate use. This combined with an almost non-existent development pipeline for retail assets will result in supply-demand dynamics slowly shifting back towards the landlord’s favour.
Conclusion
We have reflected on the struggling retail outlook, however, our view remains sanguine as even after we have rebased our rental assumptions materially downward, and slashed asset values, the retail names still look cheap. There is no doubt the long period of underperformance has coloured the market’s view on retail real estate, but in our view this has led to a ‘shoot first’ mentality when it comes to this sector. For the retail names, the market has priced in a very fearful scenario and that’s why we have maintained our overweight position in this sector.
Important Information
This material was prepared and is issued by Nikko AM Limited ABN 99 003 376 252 AFSL No: 237563 (Nikko AM Australia). Nikko AM Australia is part of the Nikko AM Group. The information contained in this material is of a general nature only and does not constitute personal advice, nor does it constitute an offer of any financial product. It does not take into account the objectives, financial situation or needs of any individual. For this reason, you should, before acting on this material, consider the appropriateness of the material, having regard to your objectives, financial situation and needs. The information in this material has been prepared from what is considered to be reliable information, but the accuracy and integrity of the information is not guaranteed. Figures, charts, opinions and other data, including statistics, in this material are current as at the date of publication, unless stated otherwise. The graphs and figures contained in this material include either past or backdated data, and make no promise of future investment returns. Past performance is not an indicator of future performance. Any economic or market forecasts are not guaranteed. Any references to particular securities or sectors are for illustrative purposes only and are as at the date of publication of this material. This is not a recommendation in relation to any named securities or sectors and no warranty or guarantee is provided.


