

Snapshot
Global economic data continues to improve and deliver positive surprises relative to pessimistic consensus forecasts. While this is undoubtedly good news, it cannot negate the fact that activity levels are still well short of pre-pandemic levels. The strong performance of equities, at least in the US, appears increasingly disconnected from this economic reality in its relentless push to ever-new highs. Apart from the economy though, there has been some good news for investors to lean on. Second-quarter earnings reported in the US were very strong, particularly in technology and ecommerce. When combined with optimism surrounding the potential arrival of a COVID-19 vaccine later this year and the US Federal Reserve’s (Fed) change in monetary policy strategy, the market’s strength can be better understood, if not justified. In the past, the Fed often tempered this level of market euphoria by eventually taking the proverbial punchbowl away. However, with the Fed seemingly endorsing higher inflation now, there seems little to suppress the urge for investors to simply buy more.
At the end of the day though, valuations do matter, as they did when markets were massively oversold earlier this year. A glimmer of hope from the significant monetary and fiscal stimulus emerging around the world pierced the abject pessimism and, like a coiled spring, jolted equities back to the upside. Although US equities now are nowhere near the nosebleed valuations of the 2000 dotcom bubble, it is important to keep a sober perspective on valuations when evaluating growth opportunities around the world. Synchronized fiscal and monetary stimulus on a global scale bodes well for reflationary growth, and we believe it will pay to seek out value opportunities that ultimately will benefit investors.
A reflationary backdrop has historically been very positive for growth assets and we believe it will be again in the period ahead. Nevertheless, the journey will be bumpy and potentially derailed if policymakers choose to scale back fiscal stimulus prematurely–a mistake that hopefully policymakers will not repeat, having learned from in the post-Global Financial Crisis (GFC) period. Coordinated global reflationary policies could well achieve the desired lift in demand as the world waits for vaccines to be widely distributed. At that point, output gaps could close quickly while central banks stand ready to let inflation run hotter than the markets have traditionally been accustomed to. We expect this environment to favour growth assets as investors will focus less on the near-term prospects of the Fed playing killjoy to the expansion and more on the likelihood of a new equilibrium of balanced inflation being achieved over the longer term.
Cross-asset1
As the world learns to live with COVID-19, new outbreaks are resulting in relatively fewer deaths and hospitalisations. Health authorities are better able to treat the infected and new cases are skewing towards younger people. As a result, governments are better able to manage the balance between restarting economic activity and protecting people’s health, allowing recovery to take hold. While this recovery may be more restrained than originally hoped, it is not being compromised. Monetary and fiscal policy remains highly accommodative and continues to provide tailwinds for growth assets. Further upside will increasingly extend beyond the US as reflationary forces take hold, particularly amid expectations that a vaccine could be available by the start of next year.
We continue to favour global equities among growth assets with smaller overweights to emerging market bonds and infrastructure. This is accommodated by underweights to the still struggling REITs sector and to a lesser extent high yield, where we are cautious given the compression in yields relative to the rising default risk in a number of industries.
Among defensive assets, we still favour investment grade credit and gold over sovereigns for the yield pick-up and reflationary hedge, respectively.
1The Multi Asset team’s cross-asset views are expressed at three different levels: (1) growth versus defensive, (2) cross asset within growth and defensive assets, and (3) relative asset views within each asset class. These levels describe our research and intuition that asset classes behave similarly or disparately in predictable ways, such that cross-asset scoring makes sense and ultimately leads to more deliberate and robust portfolio construction.
Asset class hierarchy (team view1)
")
1The asset classes or sectors mentioned herein are a reflection of the portfolio manager’s current view of the investment strategies taken on behalf of the portfolio managed. The research framework is divided into 3 levels of analysis. The scores presented reflect the team’s view of each asset relative to others in its asset class. Scores within each asset class will average to neutral, with the exception of Commodity. These comments should not be constituted as an investment research or recommendation advice. Any prediction, projection or forecast on sectors, the economy and/or the market trends is not necessarily indicative of their future state or likely performances.
Research views
Growth assets
The lift in growth assets has been extraordinary, but also relatively narrow in scope and fatigued at the edges. In July, it was the US that experienced a second virus wave and while that dissipated, now it is Europe and parts of Asia that are in focus. Just as working from home sometimes wears thin, so does the travelling virus and narrative. The shock value of a “second wave” is dissipating as policy adjustments on social distancing with a relatively small economic impact have shown to work in containing a broader spread of the virus.
When faced with the difficult question on where to allocate risk, investors have sensibly stuck with equities having the strongest earnings and outlook–namely, technology. We still rest on the notion that extraordinary fiscal and monetary policy, which is breeding a weaker dollar, will ultimately drive reflation that favours value assets, but this does not necessarily mean that growth assets such as technology have to suffer.
We are in the midst of a technology-driven disruption renaissance that is likely to continue for decades to come, but given that growth valuations can be extended at times, this could present a sensible entry point for value assets that stand to benefit from a reflationary environment.
Can growth and value coexist?
We think so. In the equities space, earnings are what matter and while growth has certainly led the pack on this basis over the last decade, they are not the only game in town. So-called “value” is reflective of the unloved portion of the market that hasn’t managed to spark a meaningful surge in earnings, leaving investors disinterested.
There are pockets of unloved industries, particularly those with excessive leverage, that deserve to remain unloved, but there are also good companies that are suffering from a protracted dry spell of growth since the GFC that may be worth looking at when reflationary forces reassert. Our perspectives on reflation do not necessarily argue for a rotation from growth to value, but rather to broaden the exposures that include a more diversified opportunity set.
Human nature pushes us to look to history as a guide to the future, acknowledging that history does not repeat but at least rhyme. Those of us who lived through the dotcom bubble on the promise of the future (and eventual earnings) sometimes see more rhyme than reason when evaluating technology compared to 20 years ago because earnings then did not meaningfully exist as compared to today.
Stock performance is noisy, and when taken at face value, one can lose touch with the fundamental underpinnings of the drivers of return. Over the long term, prices converge to a normal multiple of earnings; but in the shorter term, the multiple changes on forward expectations are heightened by fear and greed.
The following chart disaggregates performance of the contributors to return of technology (NASDAQ) versus the broader markets (S&P): dividend yield, earnings growth and the price-to-earnings (PE) premium paid on prospects for future earnings growth. PE expansion suggests speculation, but the bottom line is that earnings outperformance (NASDAQ versus S&P) is the main consistent driver of excess performance.
Chart 1: NASDAQ excess return over S&P by component drivers
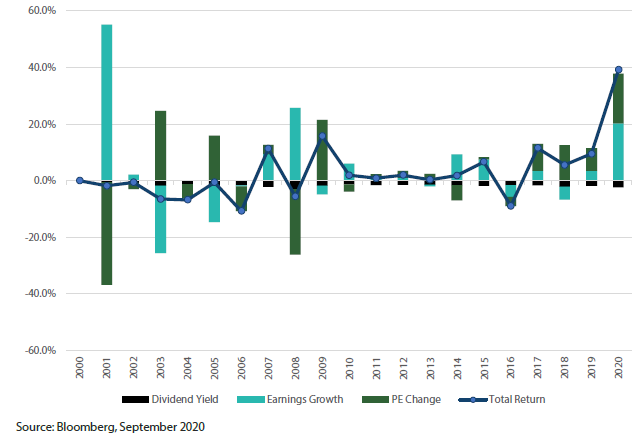
We also note that the PE expansion of the technology sector versus the broader market has been outsized since 2016. Outside of tech, earnings growth has been relatively flat, but we expect it to shift to the upside in a reflationary environment. Reflation also results in higher bond yields that can be a headwind to premiums ascribed to long-term earnings growth expectations, which is potentially negative for growth equities. While risk premiums can change, our sense is not so much of a rotation as it is of a broadening opportunity set from growth to value.
Conviction views on growth assets
- US equities lifted: We lifted our favourable view of US equities, mainly on stronger-than-expected earnings but also a quick fix to the second wave of the virus where new aggregate cases are again ebbing.
- Europe reduced: Europe still looks like a strong beneficiary of a reflationary outlook, but near-term headwinds include a resurgence in the virus, more lockdowns and clear unknowns about Brexit negotiations.
- North Asia: We increase our favourable view of North Asia for technology, even considering the US-China tech war because momentum in demand is considerable and likely to be sustained. Conversely, we reduced LatAm , looking for the right entry where reflationary effects might bolster stocks there.
- REITs still challenged: Earnings came in weak, mainly driven by the Hotel & Resort sector, which is no surprise. Unfortunately, we see these same headwinds continuing with little visibility for a turnaround over the near term, at least until a vaccine emerges.
Defensive assets
Global bond yields have risen modestly from the lows in early August but remain in the narrow ranges of the last six months. While it is true that central bank forward guidance is unabashedly dovish, increases in sovereign bond supply and a change to the Fed’s monetary policy strategy have contributed to move higher. Nevertheless, central banks are committed to maintaining a supportive monetary stance by implicitly or explicitly controlling yield curves. The result will be low bond yields and unattractive sovereign bond returns.
The recent pace of global investment grade (IG) credit spread contraction has slowed as valuations are no longer cheap. However, longer-term momentum is still positive and global monetary and fiscal policy will continue to support businesses. The yield premium of IG credit over sovereign bonds is still attractive in this environment although more of the return will come from this extra yield than further spread contraction. As a result, we continue to prefer IG credit to sovereigns.
Tolerating inflation
Back in November 2018, the Fed announced that it would conduct a “review of strategies, tools, and communication practices it uses to pursue its congressionally-assigned mandate of maximum employment and price stability”. The review lasted well over a year and Chairman Jerome Powell finally revealed changes to the Fed’s Statement on Longer-Run Goals and Monetary Policy Strategy in a speech to the annual Jackson Hole Symposium in August. The aftermath of his speech has seen analysts focus on two key elements that are likely to affect the Fed’s future attitude to monetary policy and employment outcomes.
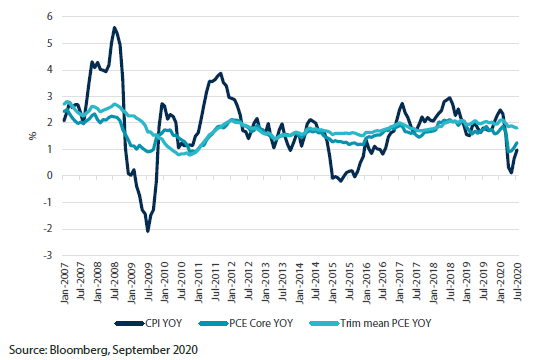
The first element is the change to how the Fed interprets its price stability mandate and target of 2% for Core Personal Consumption Expenditure (PCE) inflation. The target itself was unchanged but is now interpreted as inflation that “averages 2% over time”. The previous strategy already referred to a “symmetric” inflation target, an amendment that occurred in 2016, but this change presumably makes it even more explicit that inflation overshooting is to be expected after periods of undershooting. While this change is likely to affect the Fed’s reaction function down the road, it doesn’t do much to change the inflation dynamics of today. As we know, central banks in many countries have been trying to engineer higher inflation through their policy actions, particularly since the GFC, with little reward for their effort. Annual consumer price inflation in the US has averaged only 1.7% since 2007 and the Fed’s preferred PCE Core measure was even lower at 1.6%. The last time the Fed attempted to lift inflation expectations with changes to its strategy in 2016, inflation outcomes were little changed and continued to miss the target.
Chart 2: US inflation measures
The second key element feeds into the first and revolves around the Fed’s mandate to promote maximum employment. Prior to this change, the Fed was particularly sensitive to employment outcomes that exceeded its estimate of full employment. The inverse relationship between employment and inflation as described by the Phillips Curve had essentially resulted in tighter monetary policy when the unemployment rate was falling too rapidly. The new strategy changes the emphasis towards a less symmetric view of employment where the Fed will actively direct policy to address shortfalls in employment but would be less likely to pre-empt potentially higher inflation resulting from strong employment outcomes.
Chart 3: Yields and break-even rates
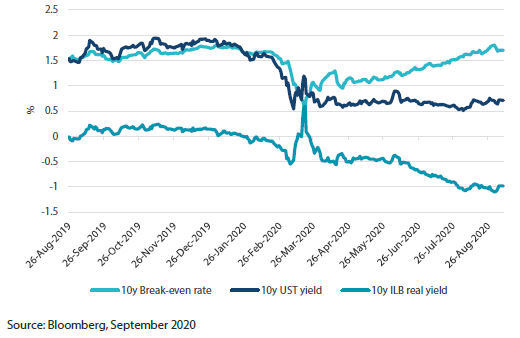
The combination of these two elements is likely to see a steeper US yield curve on average over a cycle than perhaps would have been the case under the prior strategy. However, the market’s reaction has been muted so far. US Treasury yields have trended gradually higher since early August, alongside breakeven inflation rates that have been on the move since March. With global central banks committed to highly accommodative monetary policy until economic data shows sustainable improvement, nominal yields are likely to stay low as inflation expectations continue to rise, compressing real yields in the process. As a result, inflation protection assets such as inflation-linked bonds and gold are preferred as defensive allocations.
Conviction views on defensive assets
- Take the spread in IG credit: Valuations have been rising as spreads contract. However, longer-term momentum is still positive and the yield premium of IG credit over sovereign bonds is attractive in a reflationary environment. Therefore, we continue to expect IG credit to outperform sovereign bonds.
- China still the pick of sovereigns: The People’s Bank of China has tempered expectations for further easing, on both rates and reserve requirement ratio (RRR) cuts, due to a strong recovery and easing deflationary pressures. However, it should remain accommodative as the domestic recovery has been uneven, clouded by an uncertain external outlook, especially on US-China tensions. China’s 10-year government bond yields are also at their widest margin over US Treasuries in 10 years and attracting strong foreign flows, aided by a stable renminbi.
- Inflation protection will finally pay off: We expect global central banks to be more tolerant of higher inflation and less likely to short-circuit global reflationary policies as inflation begins to rise. As a result, inflation protection assets such as gold and inflation-linked bonds will be important components of a multi-asset portfolio.
Process

