Summary
Demographics are increasingly being recognised as an important economic variable in Western economies, as millions of baby boomers enter retirement age. But this process is not just occurring in the West — the outlook for China is that it will have one of the fastest declining populations in the world. Because of this, many commentators are suggesting that China will grow old before it grows rich, meaning their growth will begin to slow before there economy can reach its full potential. This paper seeks to examine this idea in greater detail by describing some of the factors that could allow China to delay or offset its demographic decline.
Demographic outlook: Approaching the peak
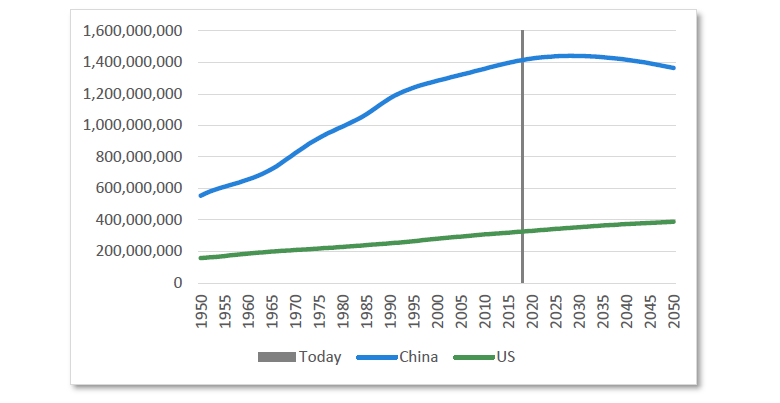
China has long been the largest country in the world by population, rising from approximately 550 million people in 1950 to over 1.3 billion people today. This represents a population over four times larger than the United States, and since the 1980s has seen tens of millions of new workers enter the global work force.
Chart 1 Population projections
Source: United Nations DESA Population Division
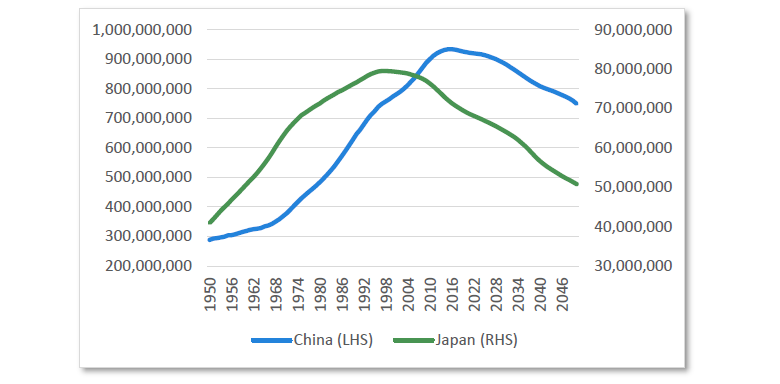
But this incredible growth will soon come to an end. The total Chinese population is projected to peak in 2030. As a result, the Chinese working age population has started to decline, in the same way that it did in Japan almost 20 years ago. For Japan, this decline ushered in a period of slower economic growth and increased debt levels. Because of this history, many commentators suggest that aging in China will knock them off their high growth trajectory, causing them to be stuck in a middle income trap.
Chart 2 Working age population: Japan and China
Source: United Nations DESA Population Division
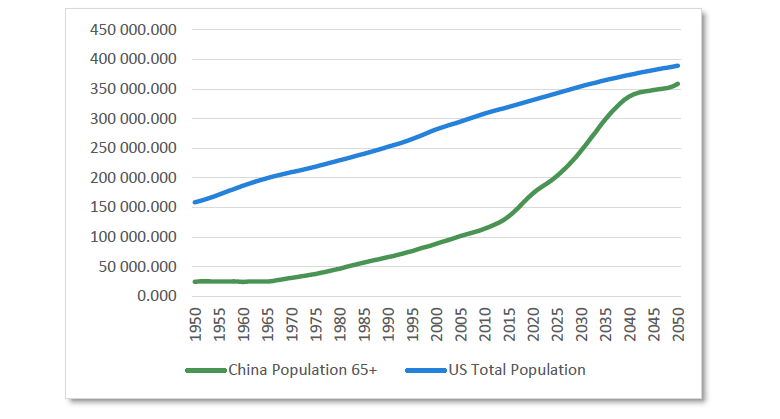
In the next 20 years the Chinese population aged 65+ is forecast to reach over 300 million people, representing over 20% of the population. This will create an elderly population almost as large as the total population of the United States; one that the world has never seen before. As explained in our article A Numbers Game: The Changing Face of Demographics, this can have profound implications for government finances, health care spending, debt levels and growth.
Chart 3 Population projections: China and the US
Source: United Nations DESA Population Division
While China mirrors some of the demographic problems of the Western world, it still has the capacity to improve growth through productivity in ways that the Western world cannot. This means a more nuanced analysis is required when comparing China to the developed world — as there is the possibility that China will continue to achieve growth, albeit at a slower level than the past 10 years, without relying on an increase in labour supply.
The offsets — Productivity, migration, farming and robotics
Productivity
One of the key drivers of economic growth is productivity, which is the ability to produce goods and services more efficiently. Compared to the developed world, McKinsey Global Institute notes that Chinese labour productivity is only “15 to 30 percent of the average in countries that are part of the Organisation for Economic Co-operation and Development (OECD)”1 , making China relatively inefficient compared to its OECD counterparts. This means that China has enormous potential to achieve strong productivity growth by simply adopting “best practices”, which are already in use throughout the world.
McKinsey forecasts that this could add over 4% productivity growth per year in Emerging Markets2. With this level of productivity growth, China would continue to see solid levels of output growth even with a declining workforce, allowing incomes to rise across the country as more output can be achieved per worker.
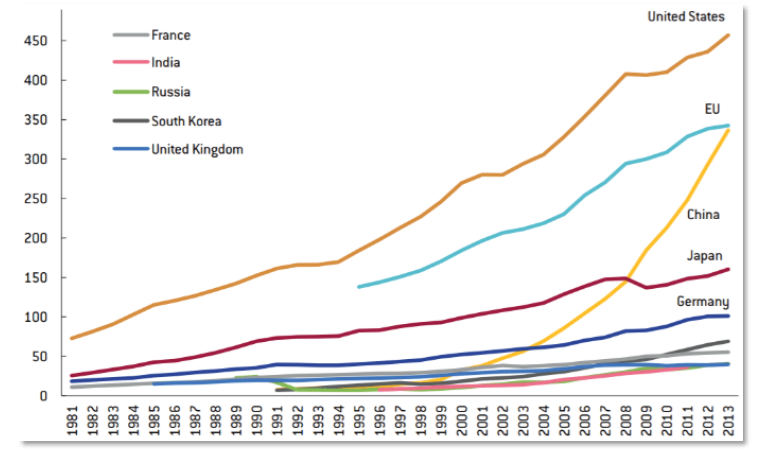
In addition, China is now one of the largest research and development spenders in the world. Brugel reported in 2017 that China “Has emerged as a new science and technology (S&T) powerhouse” with Chinese research and development (R&D) investment “growth greatly exceeding that of the U.S. and EU.”3Over the past 20 years, China has risen from a negligible share of global R&D spending to 20 percent of the total. This places China at the forefront of science and technology, with a particularly strong emphasis on becoming a leader in artificial intelligence. Furthermore, China generates the greatest number of undergraduates with science and engineering degrees, showing their commitment to moving up the value chain and becoming a global leader in innovation. This gives China the ability to do more than just borrow Western best practices. It allows them to create productivity enhancements in their own right.
Chart 4 Research and development spending in billions of dollars (in purchasing power parity terms)
Source: Bruegel based on NSF (2016)
Given China has the ability to implement Western best practices, has a large consumer market to entice foreign investment, and is financing huge amounts of research and development, there is a good probability that China will continue to improve productivity and climb the income scale.
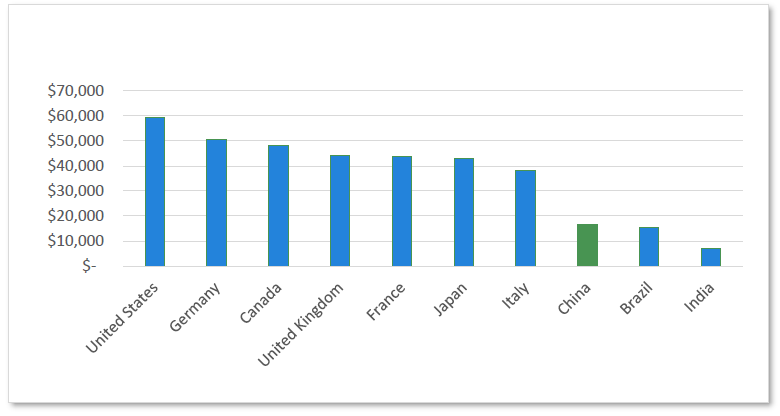
While China has become the second largest economy in the world, in terms of total Gross Domestic Product (GDP), it still has per capita income of just over $16,000. This is only 44% of Italy’s GDP per capita, an economy often described as the sick man of Europe. The fundamentals described above would see the gap between China and the rest of the developed world continue to close in the coming years, allowing the Chinese population to become wealthier.
Chart 5 World’s 10 largest economies — GDP per capita (on purchasing power parity)
Source: CIA World Factbook
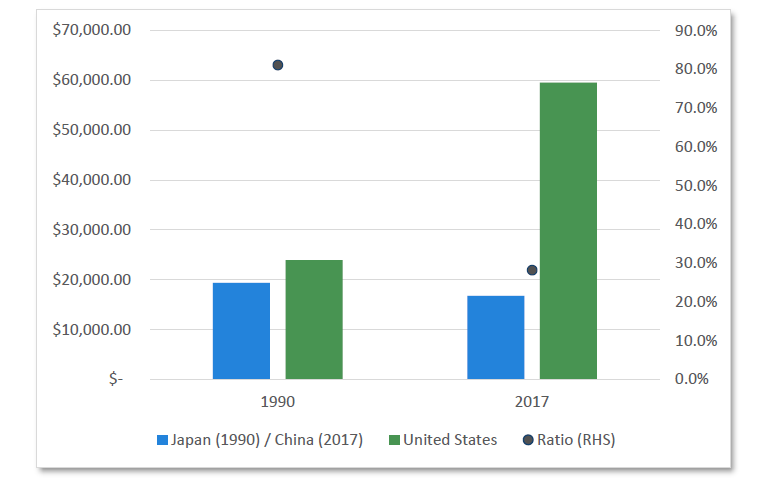
China’s position differs considerably to the situation in Japan in the 1990s. Japan already represented a high income country when it entered its demographic decline. According to World Bank Statistics, at the height of the Japanese growth story in 1990, GDP per capita was ~ $20,000 — approximately 81% of that of the United States. As of 2017, however, China has achieved GDP per capita of only 30% of that of the United States, putting China in a very different economic position that Japan found itself in.
Chart 6 GDP per capita (PPP)
Source: The World Bank
Farming and migration
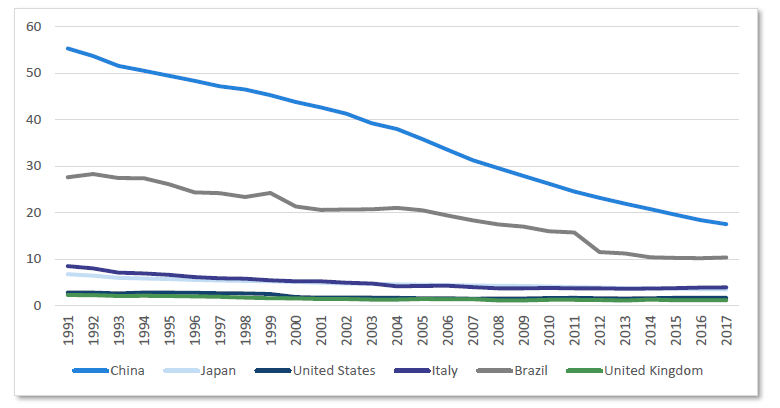
China could offset the effects of its declining population through rural migration and improved agricultural efficiency. According to World Bank statistics, approximately 17% of the Chinese workforce is employed in the agriculture sector, which contributes only 10% of total GDP. As the Chart 7 shows, there is a relatively high percentage of workers in agriculture compared to Western economies, which typically range between 1 and 5%. A problem with this model is identified by the Cheung Kong Graduate School of Business, which stated that “In 2013, 86% of farms in China were only 1.6 acres”, much smaller than the “average 441-acre US industrialized farm”4.
Overall, when compared to its developed peers, the Chinese farming system relies more on physical labour than mechanisation. Given the agricultural employment base is also aging, the Journal of Mathematical Problems in Engineering suggests that policy should be aimed at increasing training to “Nurture professional farmers”, improving “scientific and technological levels” and promoting “large-scale production”5.
Chart 7 Agriculture employment (% of total employment)
Source: The World Bank
Unlocking even 5% of the labour force to move from agriculture to other sectors could dampen the effect of aging. For example, over the next 10 years the working age is set to decline by almost 29 million people, which represents a 3.1% decline. By improving agricultural efficiency, these workers could fill the gaps of those retiring and encourage greater urbanisation in the country. This would have the additional benefit of improving GDP and incomes, as the average urban resident earns more than twice as much as their rural counterparts. In this regard, achieving agricultural efficiency is a relatively simple way to enhance incomes and has the added benefit of also providing greater food security in the face of a declining agricultural labour pool.
Robotics
Another way China could partially offset the decline in its working age population is through robotics. This is not unique to China — the same potential exists in the developed world.
The pace of robotics has been intensifying over the past few years with breakthroughs in artificial intelligence, and rapidly falling costs greatly enhancing their viability. As a population ages it is a natural response to try to introduce robotics to reduce the reliance on labour. A researcher from the Massachusetts Institute of Technology recently stated that “Demographic change—corresponding to an increasing ratio of senior to middle-aged workers—is associated with pronounced increases in the adoption of robots and other automation technologies across countries”6.
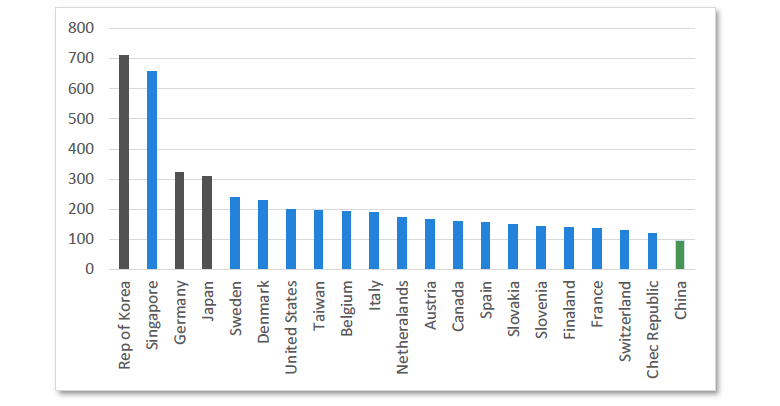
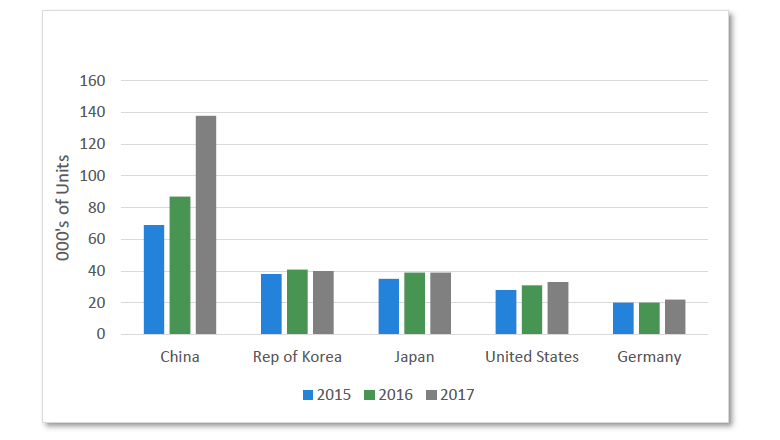
According to The International Federation of Robotics, as of 2017 “China has significantly expanded its leading position” in robotics, “with the strongest demand and market share of 36 percent of the total supply in 2017”7. Compared to their industrialised and aging peers (such as Japan, South Korea and Germany), China has a relatively low level of robot density at only 97 robots per 10,000 employees as can be seen below.
Chart 8 Number of installed industrial robots per 10,000 employees in manufacturing (2017)
Source: International Federation of Robotics
This means that not only is China actively trying to become a leader in the robotics industry to improve its position in the global value chain, it also has immense capacity to industrialise its own manufacturing sector, which will dampen the effect of a declining labour pool. This could have a double effect in terms of output in that China could capture a large share of a high value-add industry while also easing the effects of a declining labour pool by substituting in capital. Overall this would improve incomes as the output of each worker will be greater without requiring a lot of new employee. This has already begun and is increasing at an incredible pace.
Chart 9 Estimated supply of industrial robots
Source: International Federation of Robotics
Exploring income — How rich is rich?
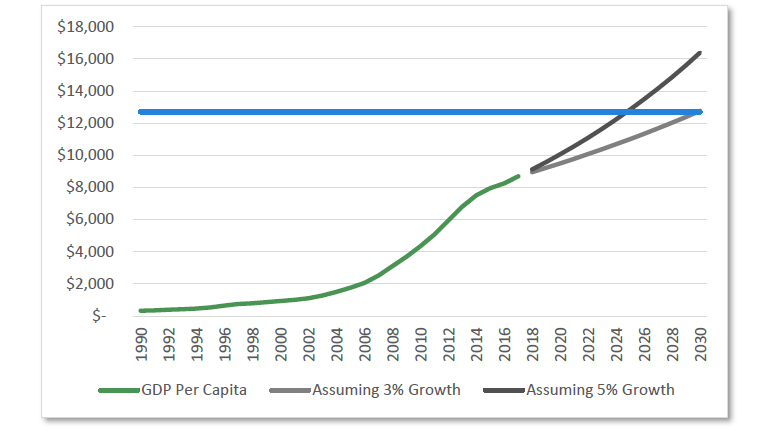
The final point to explore here is to ask the simple question, “What defines rich?” According to the World Bank, a high income country is one which has Gross National Income (GNI) per capita above USD 12,056 as of 2017. In US dollar terms, China’s 2017 GNI per capita is approximately $8,700, up from $940 and $4,300 in 2000 and 2010 respectively. Even at a 3% growth rate (less than half of what they have recently been achieving) China would reach this high income threshold in around 12 years-time. From this perspective, China will likely become ‘rich’.
Chart 10 China GDP per capita (US dollar terms)
Source: World Bank
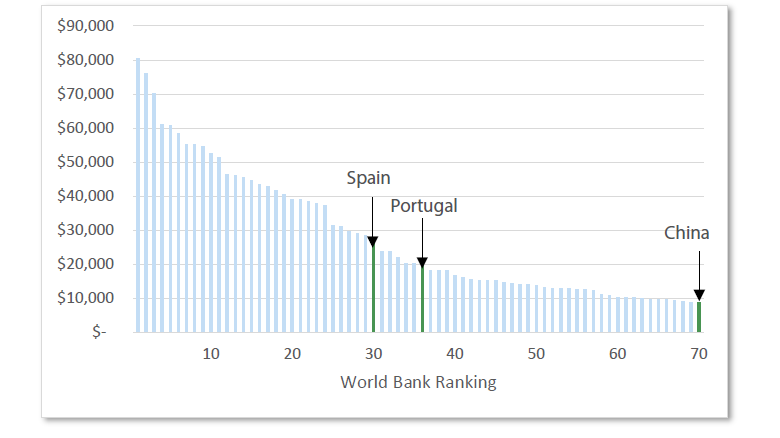
When analysts adopt the idea that China will get old before it gets rich, it seems unlikely that they are using the World Bank’s high income definition, but rather a higher Western Developed World level. For example, using the 50th richest countries in the world would produce examples such as Portugal ($19,820) or Spain ($27,180) as comparables, which rank in the 30s for global income levels using World Bank Statistics. Applying this level would require current incomes in China to double, which may end up being more than the economy can handle before old age sets in. However, if China can adopt Western Best practices, find advancements in science and improve labour output through capital, an argument for the 4% productivity growth described by McKinsey is not out of the realm of possibilities. Under this type of growth scenario, China’s income would rise towards the current Spanish and Portuguese levels in around two decades.
Chart 11 Global GDP per capita (US dollar terms)
Source: World Bank
Regardless of the level of income that is described as ‘rich’, China is already an enormous economy that is the second largest in the world. As of 2015, Credit Suisse Global Wealth stated that China had the world’s largest middle class, at some 109 million adults compared to the United States at 92 million. With even modest levels of income growth, this middle class will continue to expand drastically, creating continued demand for global goods and making China a true economic power. On its current trajectory, China will become the world’s largest economy over the next 10 to 20 years. This alone might be enough to subjectively define them as rich.
Conclusion
The risk to the Chinese growth outlook going forward is that the growing population of people aged 65+ will create a burden that cannot be controlled and will hamper economic growth. While this demographic trajectory will be a key variable for the Chinese government to measure, it is not a foregone conclusion that it must halt incomes in their tracks. Unlike the developed world, China still has the ability to improve productivity by importing knowledge. They can unlock a large percentage of the workforce by improving agricultural practices, and being one of the fastest growing regions for robotics. China can offset a declining labour pool. Overall this means that with the right policy settings, China has the ability to continue climbing the income ladder and moving their population into the middle class. Their population trajectory does not necessarily have to relegate them to a middle income trap.
1McKinsey Global Institute (2016) Capturing China’s $5 trillion productivity opportunity. https://www.mckinsey.com/featured-insights/employment-and-growth/capturing-chinas-5-trillion-productivity-opportunity
2McKinsey Global Institute (2015) Global Growth: Can Productivity Save The Day In An Aging World? https://www.mckinsey.com/~/media/McKinsey/Featured....
3Veugelers, R. (2017) China Is The Worlds New Science And Technology Powerhouse. http://bruegel.org/2017/08/china-is-the-worlds-new-science-and-technology-powerhouse/
4 Nunlist, T. (2017). Down On The Farm: Agriculture In China Today. http://knowledge.ckgsb.edu.cn/2017/02/06/agriculture/china-agriculture-today/
5 Guo, G., Wen, Q. & Zhu, J. (2015). The Impact of Aging Agricultural Labour Population on Farmland Output: From The Perspective Of Farmer Preferences. https://www.hindawi.com/journals/mpe/2015/730618/
6 Acemoglu, D. & Restrepo, P. (2017) Demographics and Automation. https://www.brown.edu/academics/economics/sites/brown.edu.academics.economics/files/uploads/paperdemographics_automation_daron.pdf
7 IFR (2018) Global Industrial Robot Sales Doubled Over The Past Five Years. https://ifr.org/ifr-press-releases/news/global-industrial-robot-sales-doubled-over-the-past-five-years


